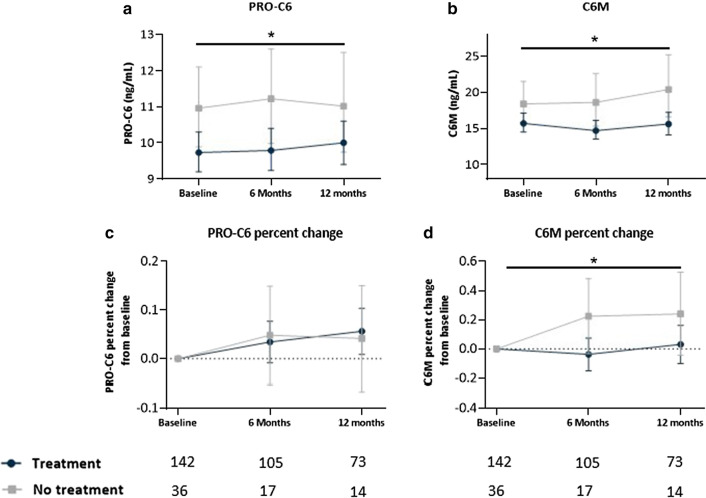
Fig. 2.
Longitudinal levels of type VI collagen biomarkers in treated and untreated IPF patients. Serum levels of PRO-C6 (A) and C6M (B) are shown at baseline, six months and 12 months for treated (nintedanib/pirfenidone) (dark blue) and for non-treated (grey); percent change from baseline in PRO-C6 (C) and, C6M (D) at six months and 12 months for treated (dark blue) and non-treated (grey) patients with IPF. Data are presented as geometric mean with 95% CI (error bars) adjusted for age and sex (C and D were also adjusted for PRO-6 or C6M baseline levels). The number of evaluable samples available for analysis at each time point is provided below the graphs. The interaction between timepoint and treatment was not significant for PRO-C6 (P = 0.75), PRO-C6% change (P = 0.60), C6M (P = 0.53) and for C6M percent change (P = 0.77). Significant average contrast across all timepoints between treatment and non-treatment for PRO-C6 and C6M is shown as * (P < 0.05)

