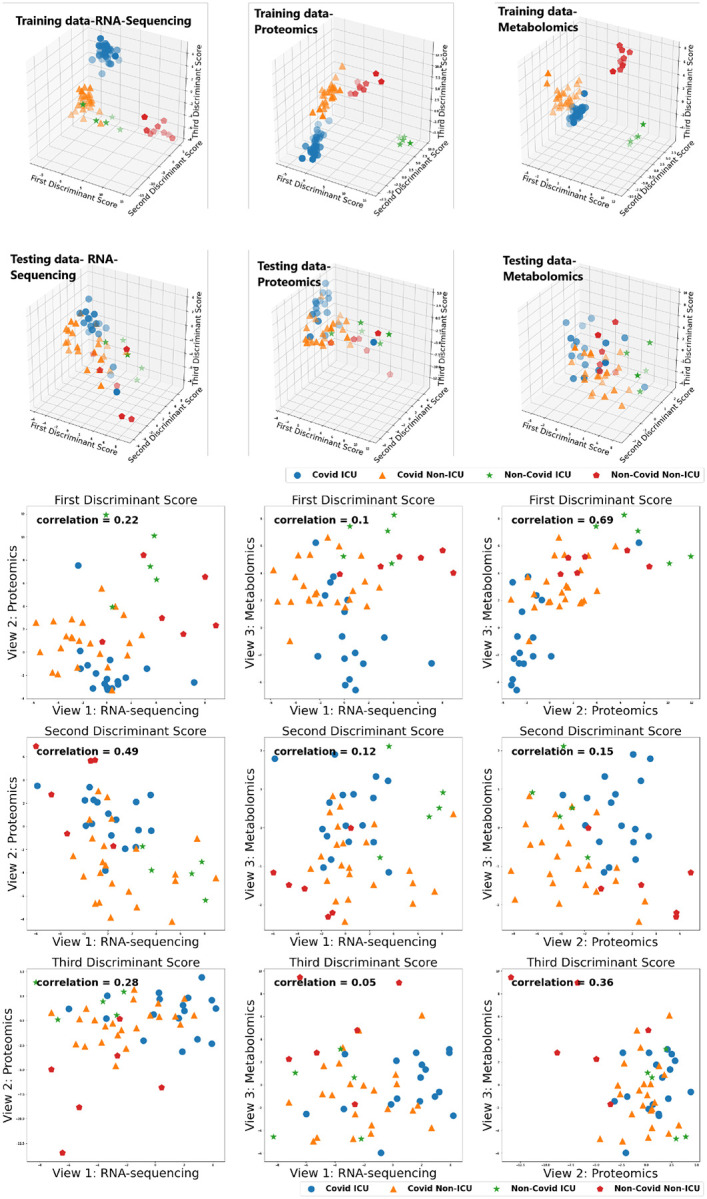
Figure 5:

Discrimination (3-D) plots: COVID-19 patient groups are well-separated in the training data. From the testing data, the COVID ICU group seems to be separated from the COVID NON-ICU and NON-COVID ICU groups, especially in the RNA-sequencing and proteomics data. Correlation plots (2-D): Overall (combining all three discriminant scores), the mean correlation between the metabolomics and proteomics data was highest (0.4) while the mean correlation between the metabolomics and RNA-sequencing data was lowest (0.09).
