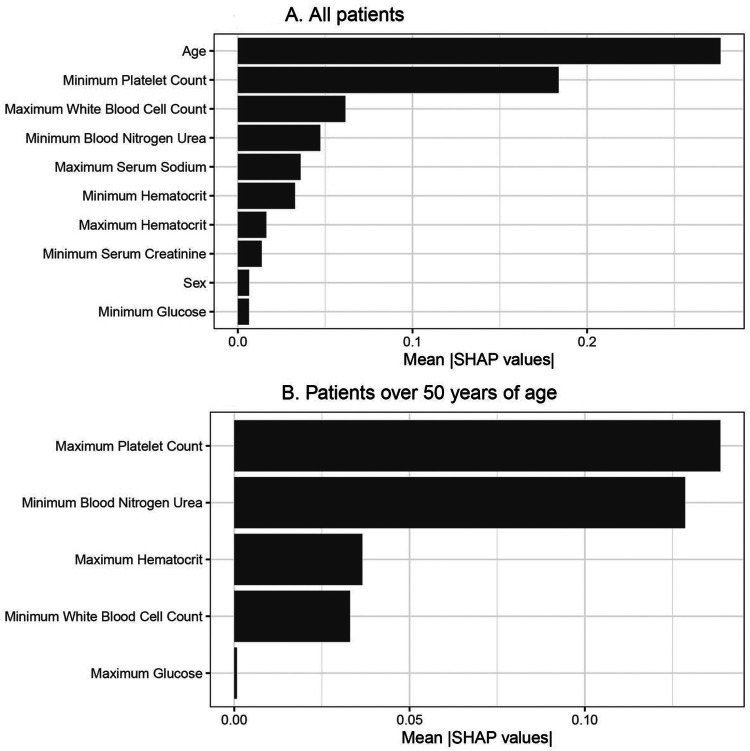
Figure 2.
Variable importance plots for mortality in all patients and in patients over 50 years of age. A. Mean SHAP values are provided on the x-axis, which shows that age, minimum platelet count, maximum white blood cell count, minimum blood urea nitrogen, maximum serum sodium, minimum haematocrit, maximum hematocrit, minimum serum creatinine, sex and minimum glucose are the top-10 variables. B. Mean SHAP values are provided on the x-axis for the mortality prediction model in patients over 50 years of age, which includes the five selected variables: maximum platelet count, minimum blood urea nitrogen, maximum hematocrit, minimum white blood cell count, and maximum glucose.

