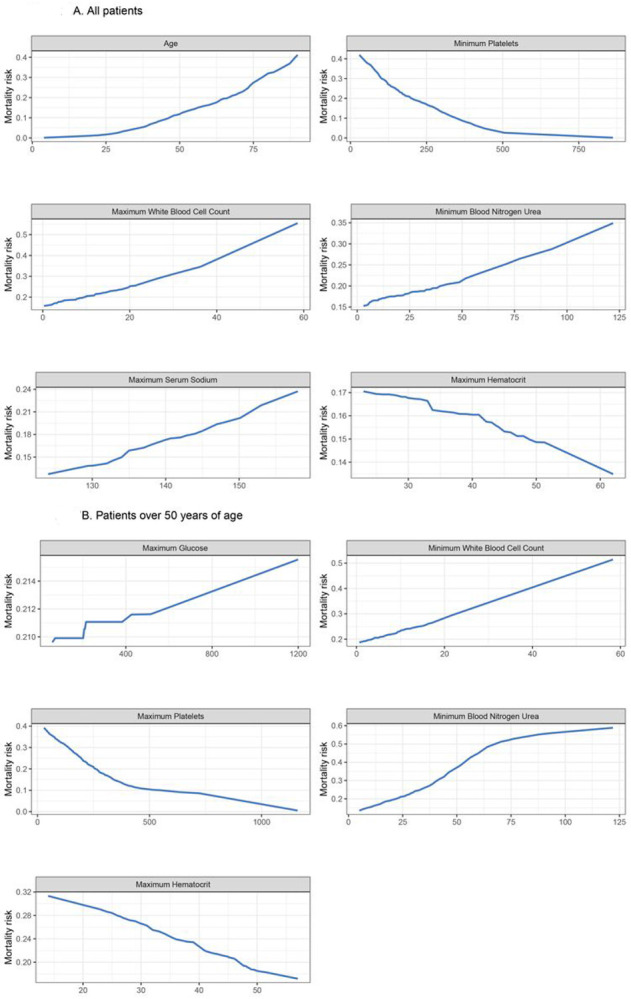
Figure 3.

Partial dependence plots for mortality prediction model illustrating the relationship between mortality and the six top predictor variables A. Risk of mortality increases with increasing age, platelets < 500 109/L, and increasing white blood cell count. Risk of mortality increases with increasing blood urea nitrogen with an inflection point at 50 mg/dL. The risk of mortality increases with decreasing haematocrit levels and increasing sodium levels. B. Risk of mortality increases with increasing age, platelets < 500 109/L, and increasing white blood cell count. Risk of mortality increases with increasing blood urea nitrogen until 75 mg/dL and then levels off. The risk of mortality increases with decreasing haematocrit levels
