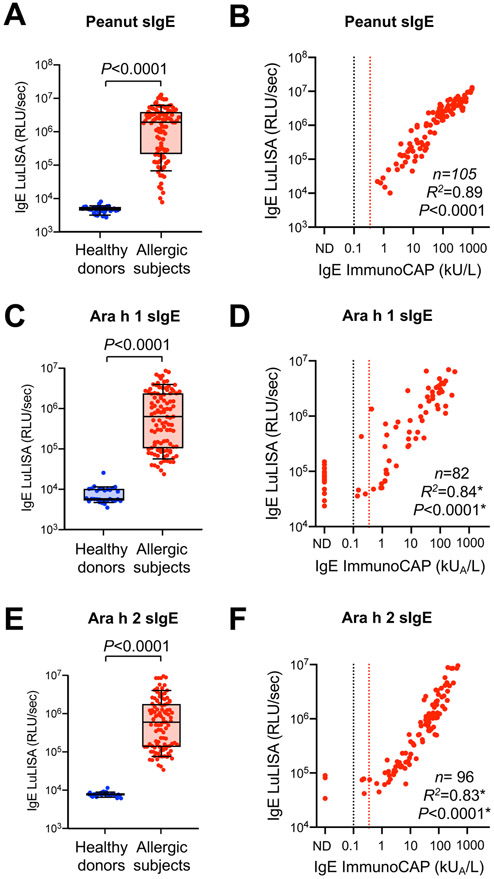
Figure 2. Detection of sIgE levels by LuLISA in 1 μL plasma samples from healthy donors and peanut allergic subjects.
(A, C, E) Levels of peanut sIgE (A), Ara h 1 sIgE (C) or Ara h 2 sIgE (E) by LuLISA in 1 μL plasma samples from 31 healthy donors and 82-105 peanut allergic subjects. Data in A, C and E are shown as box and whisker plots (10th and 90th percentiles), and each circle represents an individual patient. P values were calculated by nonparametric Mann-Whitney test (2-tailed). (B, D, F) Correlation between peanut sIgE (B), Ara h 1 sIgE (D) or Ara h 2 sIgE (F) by LuLISA vs. ImmunoCAP. Black dashed line indicates ImmunoCAP cut-off level (0.1 kUA/L); Red dashed line indicates cut-off level commonly used in clinical practice (0.35 kUA /L). RLU: relative light unit. *Pearson’s R2 correlation coefficients and P values (two-tailed) were calculated using all samples above the ImmunoCAP cut-off level (0.1 kUA/L).

