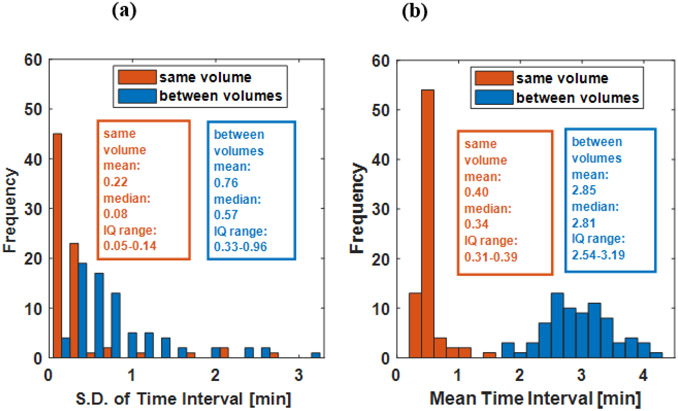
Figure 2:
Histograms of sampling interval statistics for each bladder experiment. The standard deviations (S.D.)(a) and means (b) of sampling intervals of each experiment were calculated for intervals between measurements collected at the same filling volume (orange) and intervals between measurements collected before and after the transition to a different filling volume (blue). The statistics reported in the text box are for the respective histogram (IQ range: interquartile range).

