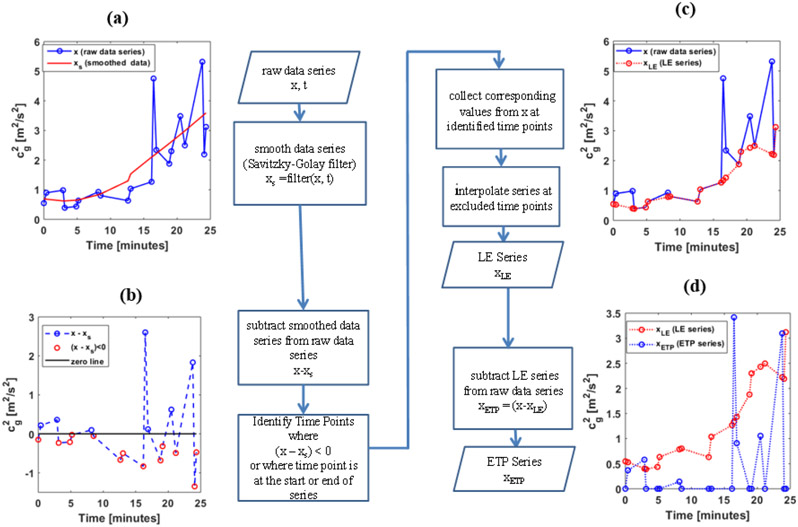
Figure 4:
Flow chart of peak identification process. (a) Raw data series is smoothed using a 2nd-order Savitzky-Golay filter. (b) The Raw data is differenced by the smoothed data and the time-points where values falling below the smoothed curve (i.e. having a negative value) are identified. The identified time points are used to define the LE series from the raw data series by interpolating points in between (c). (d) The difference between the LE series and the raw data series determines the ETP series.

