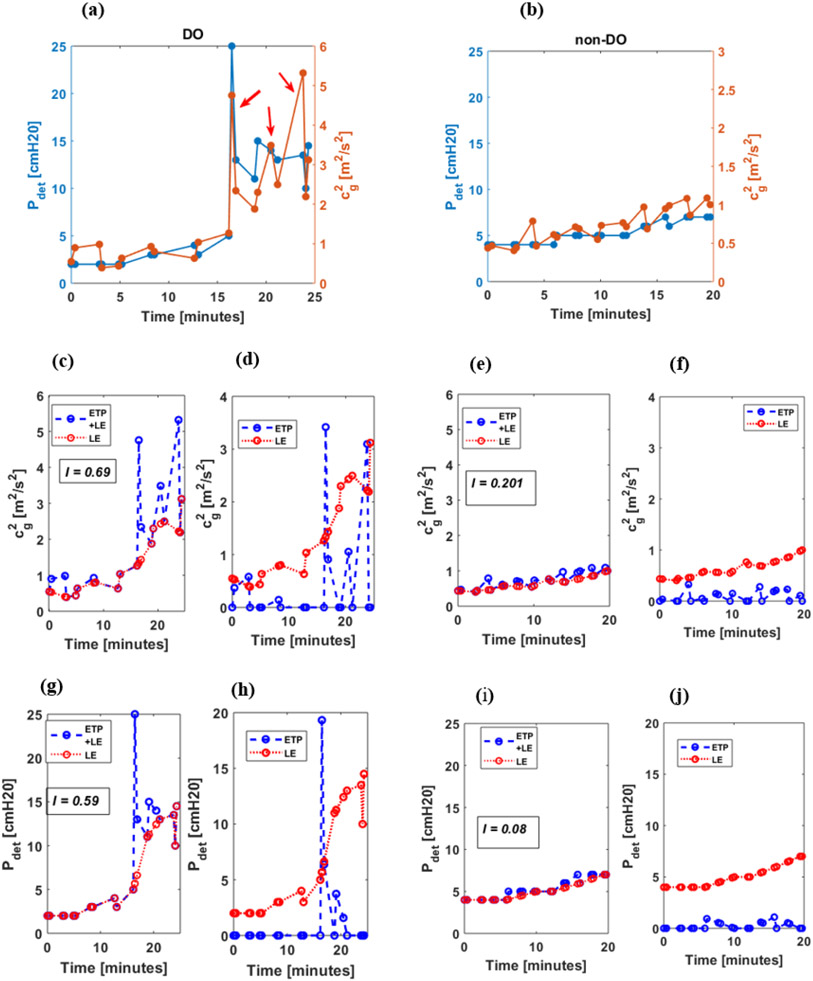
Figure 5:
Representative cg2 and Pdet data series for DO (left) and non-DO (right) bladders. Top row displays dual-axis plots of both data series, Pdet and cg2. The red arrows in (a) indicate the peaks associated with DO. The same series are shown in the middle (cg2) and bottom (Pdet) rows are shown with lower envelope (red) overlaid on the raw series (blue) (c,e,g,i) to illustrate the decomposition of the raw series into ETP and LE series. The separated ETP (blue) and LE (red) series used to calculate the signal index (I) are shown in (d,f,h,j). Note that the identified ensemble of peaks for the data series is the difference between the raw series and the lower envelope.

