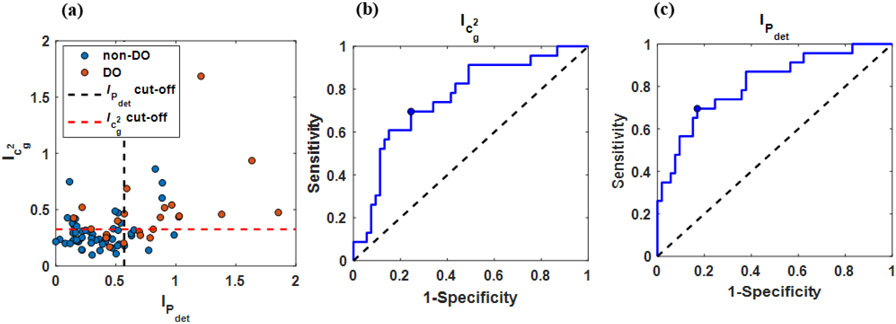
Figure 6:
Graphical results of statistical and diagnostic analysis. Scatter plot of cg2 signal index against Pdet signal index (a). The black and red dashed lines denote cg2 and Pdet cut-offs respectively. ROC curves producing by using the signal index (I) as a classifier for DO applied to cg2 (b) and Pdet (c). The blue circular markers denote the selected optimal cut-off.

