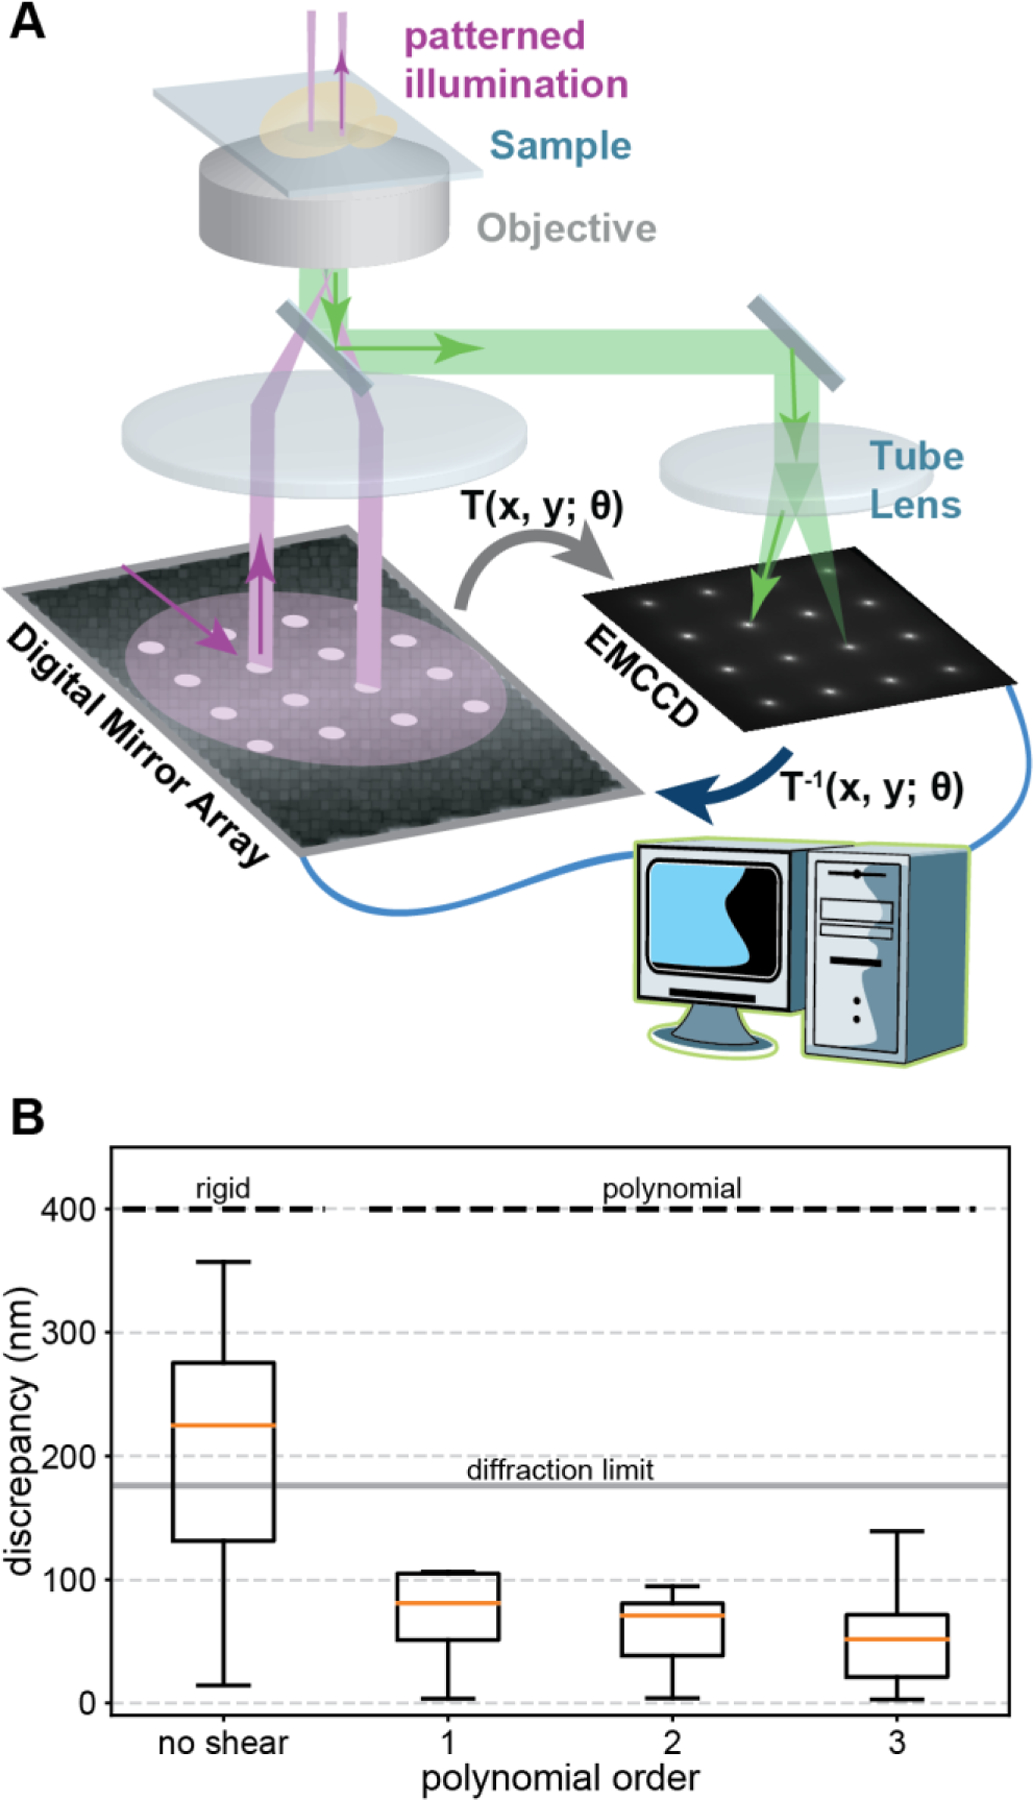
Figure 1: Schematics of spatially informed illumination setup and calibration.

(A) A digital micromirror device is mounted in the excitation path of a PALM microscope. Pixels in the on state reflect laser light, which gets projected onto the back focal plane of the microscope objective (purple, 4F lens system not shown for clarity). The fluorescence (green) of the calibration pattern of 4×4 spots is recorded with the camera and the transformation T between the DMD and camera coordinate system is determined with a computer to correct for rigid and higher order polynomial distortions caused by optical components [47,48]. (B) Varying degrees of freedom are included in the inverse transformation T−1 of the calibration pattern to correct for distortions. (Left) Rigid degrees of freedom simulating a perfect manual alignment result in a significant median discrepancy above the theoretical diffraction limit of the emission peak of fluorescein. (Right) Including higher order polynomials in T−1 results in an accurate matching of the DMD and camera coordinate system with a median discrepancy well below the diffraction limit. Boxes extend from the 25th to 75th percentiles (interquartile range, IQR). Medians are shown as orange horizontal lines. Whiskers extend to the farthest data point within 1.5 IQR below and above the 25th and 75th percentiles, respectively.
