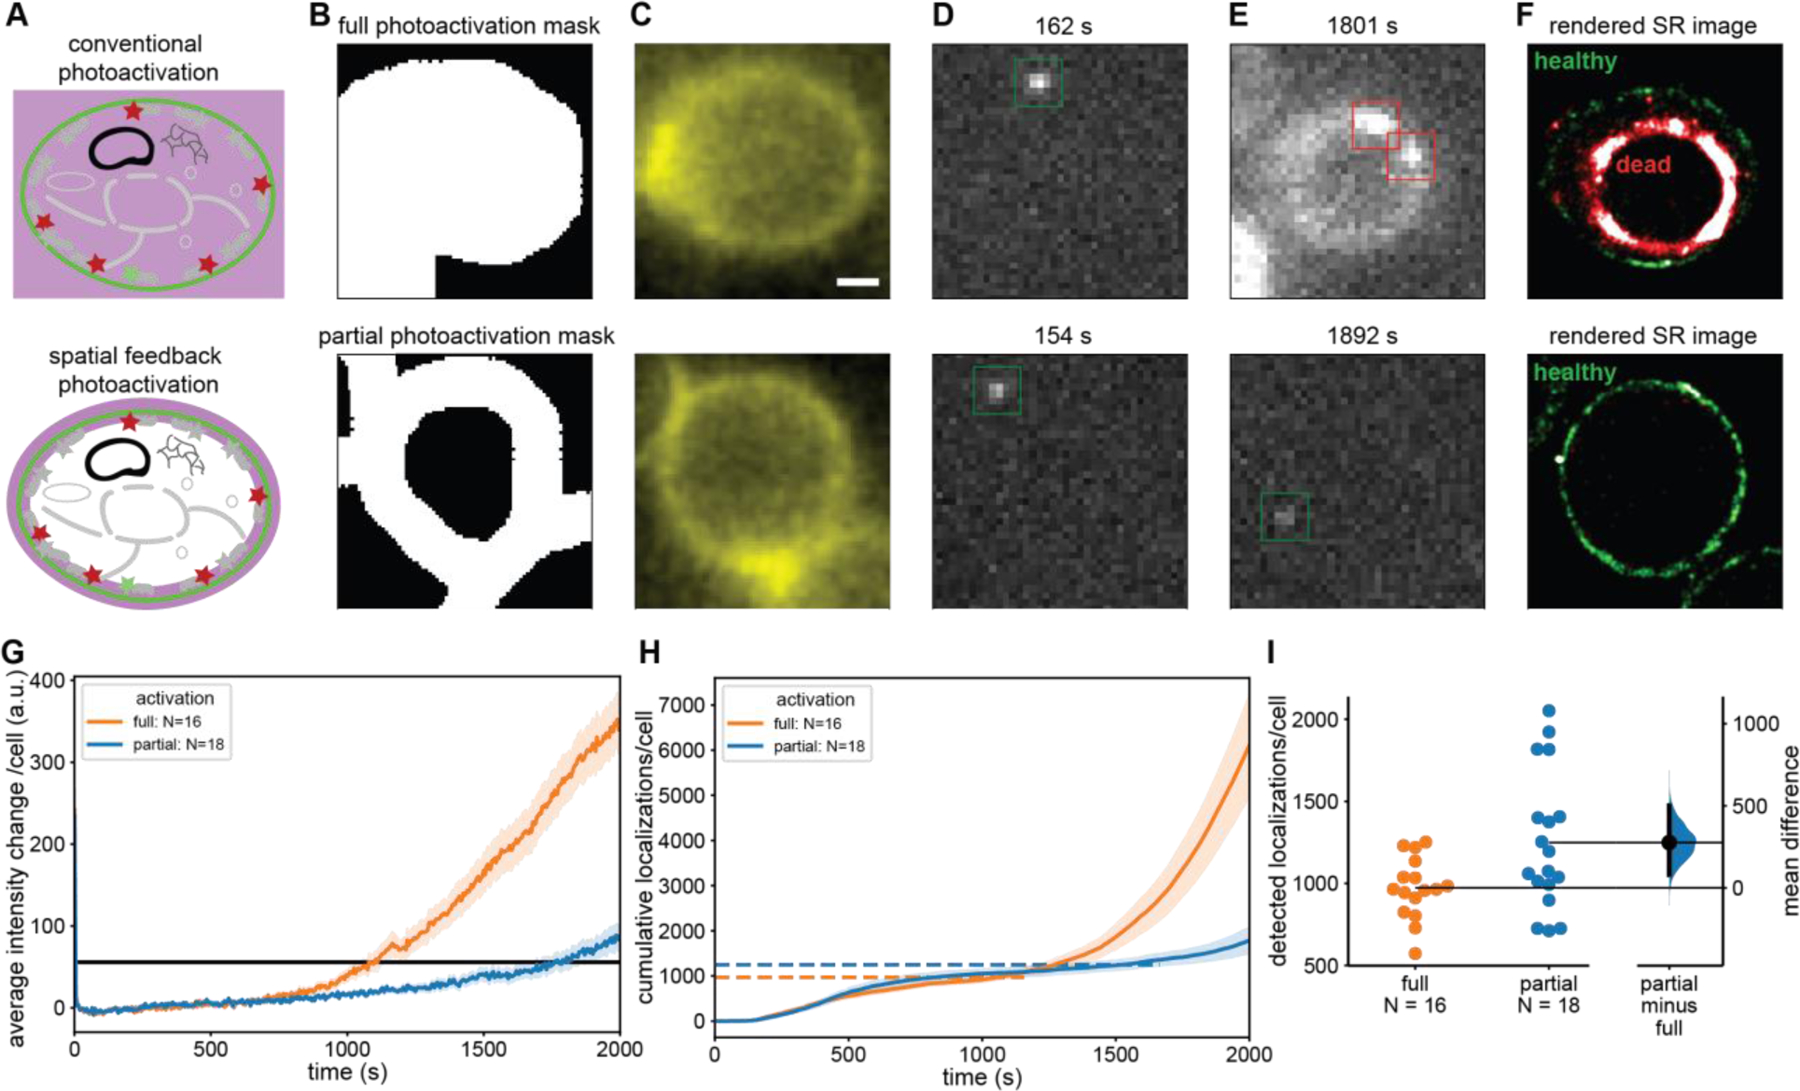
Figure 3: Spatially informed photoactivation significantly improves SMLM image quality through an increased number of localizations.

(A) In conventional PALM the entire cell is exposed to 405 nm photoactivation light (upper) whereas in spatially informed PALM only the regions that contain PAFPs are photoactivated (lower). (B) A mask is selected covering the entire cell (upper) and another mask which excludes the cytoplasm covering only the PM where mEos2 is located (lower). (C) Fluorescence image of CF488M conjugated to ConA excited at 488 nm used to create the mask in (B). (D, E) Individual frames with single-molecule localizations of mEos2 under 561 nm excitation at early (D) and late (E) timepoints during PALM data acquisition. The fully illuminated cell shows signs of phototoxicity including autofluorescence much sooner (upper) than the partially illuminated cells (lower). (F) Rendered PALM image showing mEos2 localizations while cells are healthy (green) and after the transition to the unhealthy state (red). (G) Mean autofluorescence intensity change of fully and partially illuminated cells (orange and blue respectively) under 561 nm excitation and cutoff for transition to unhealthy state (black line). (H) Mean cumulative localizations of fully and partially illuminated cells (orange and blue, respectively) with horizontal dashed lines showing the mean number of localizations at the cutoff time. Localizations after the transition to the unhealthy state are unreliable and predominantly caused by autofluorescence. (I) Gardner-Altman plot of the total number of localizations from fully and partially illuminated cells up to transition to unhealthy state compared at the 95% confidence interval. (Mann-Whitney p < 0.05) [49] A significant 28% increase in reliable mEos2 localizations is detected in spatially informed PALM compared to conventional PALM. Error bands: standard error of the mean across cells. Top and bottom of B, C, D, E, and F are the same scale. Scale bar is 1 µm.
