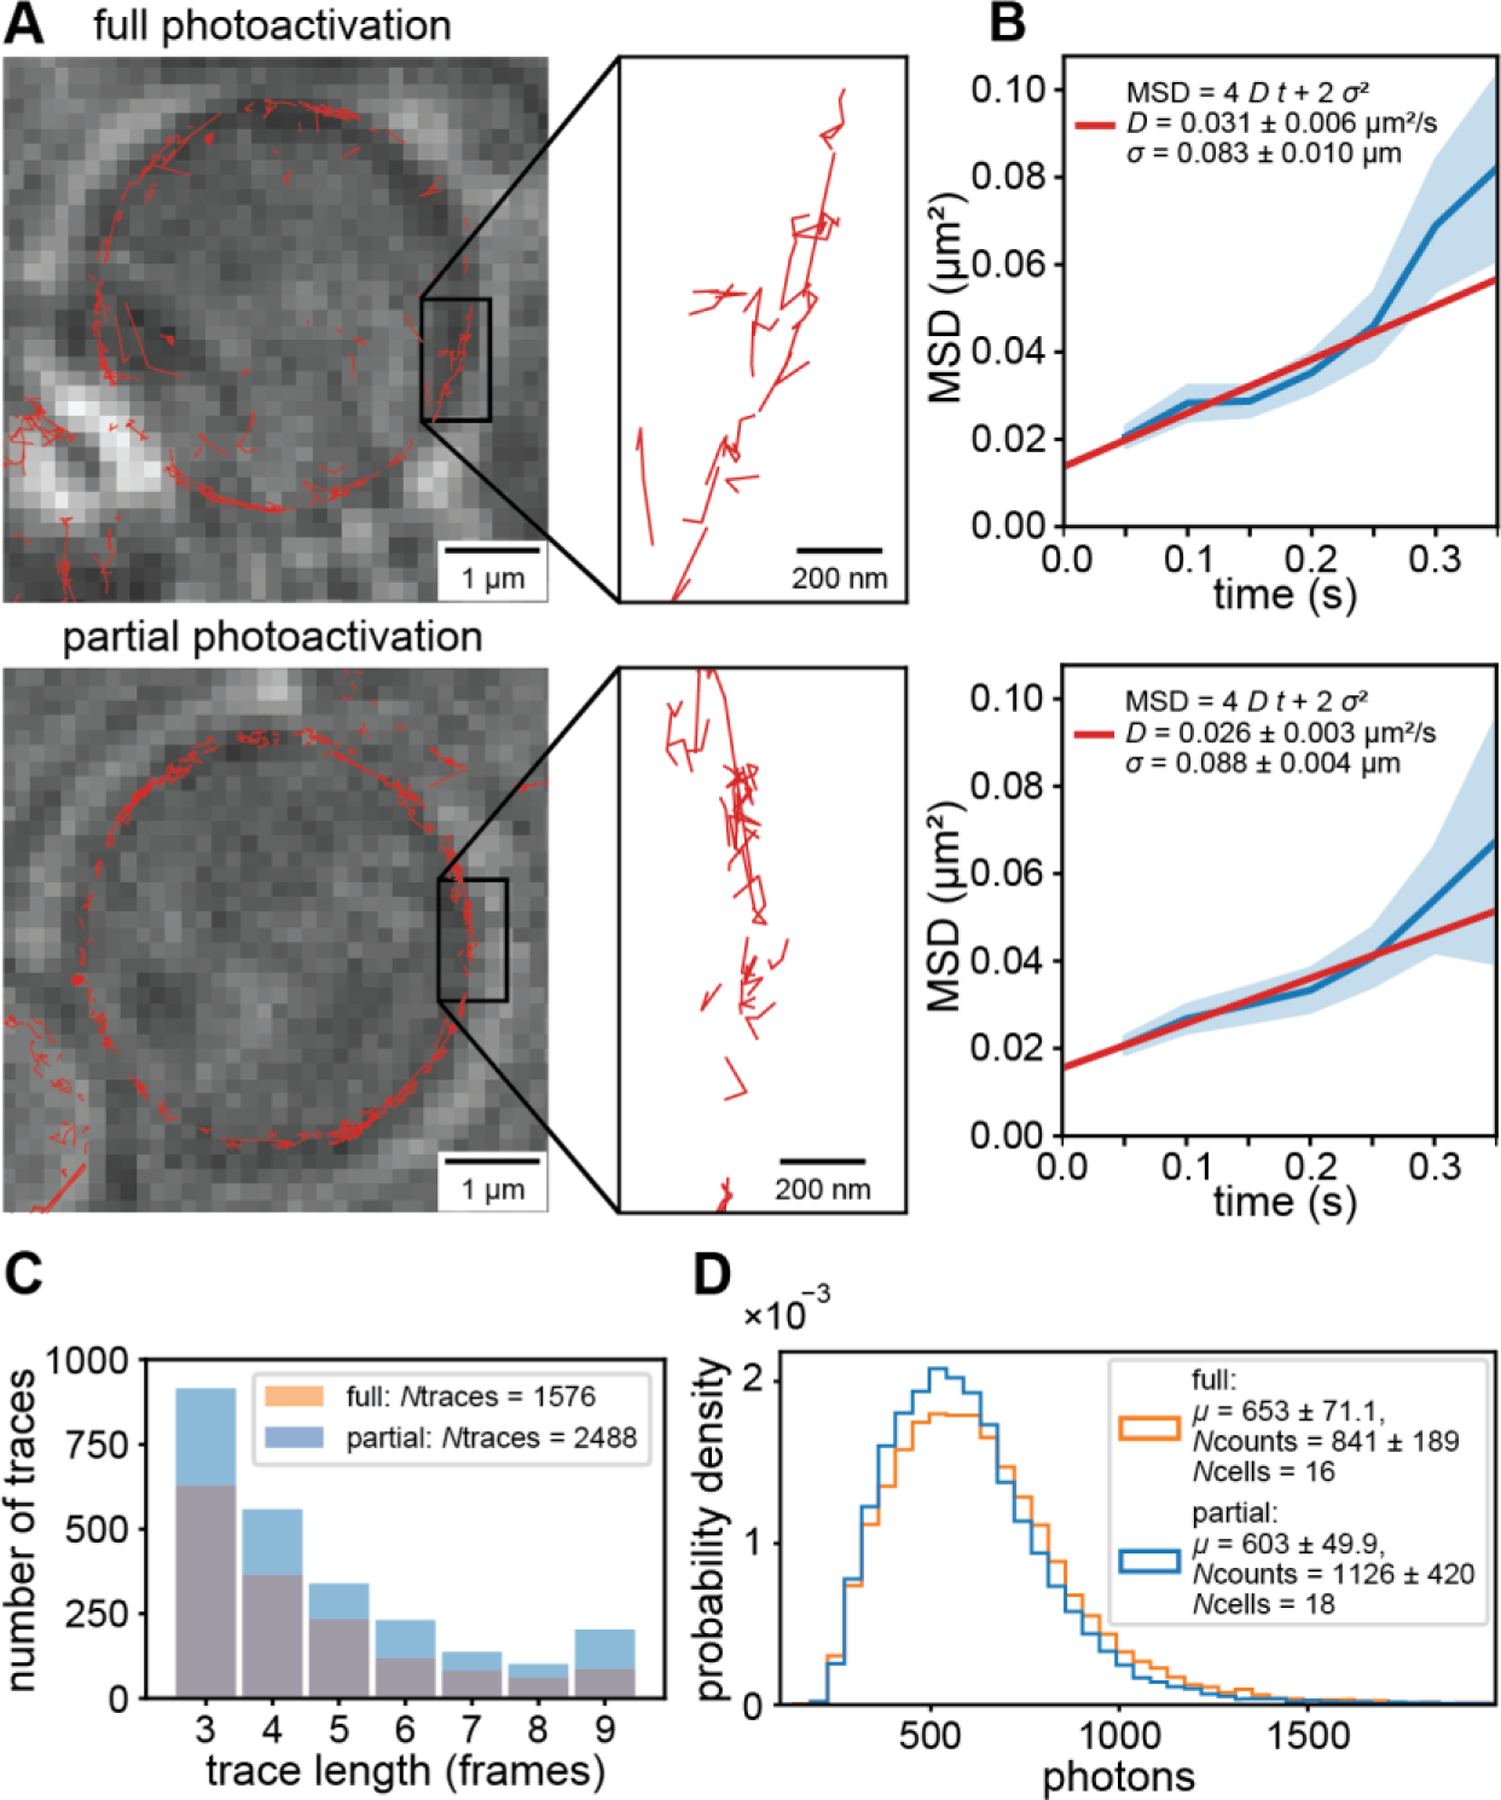
Figure 4: Comparison of single-molecule tracking with conventional and spatially informed PALM.

(A) Single-molecule traces (red) superimposed on LED images (average of 10 frames) of fully (top) and partially photoactivated cells (bottom). (B) Mean squared displacement vs. time (blue) and fit to model (red) of fully and partially illuminated cells (top and bottom, respectively). Error bands are the standard error of the mean across each lag time. (C) Distribution of trace lengths showing an increased number of detected single molecule traces of partially photoactivated cells compared to fully photoactivated cells. All single-molecule traces and localizations were analyzed up to the mean transition time to unhealthy state. (D) Probability density of photons per single-molecule localization showing that the quality of localizations is the same for fully and partially photoactivated cells.
