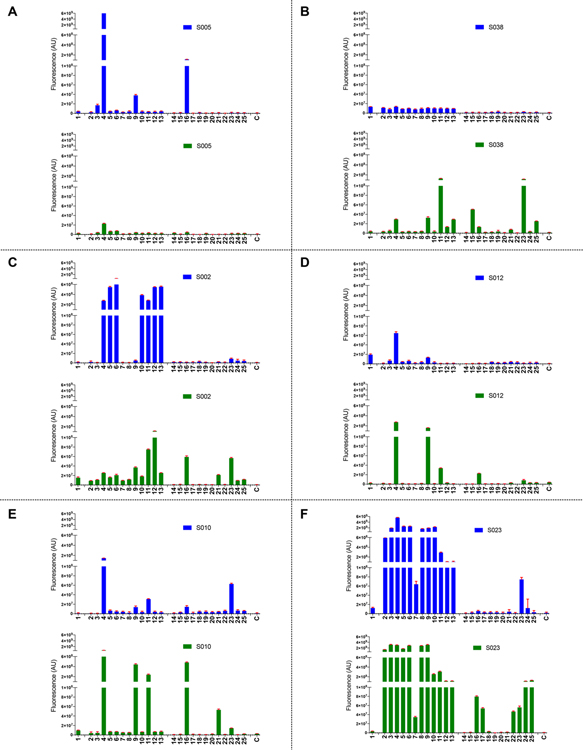
Figure 3.
Microarray results of the synthetic ganglioside library (1–25) at 100 μM with serum samples (1:500) (A) S005, (B) S038, (C) S002, (D) S012, (E) S010, and (F) S023. For each sample, the graph at the top shows in blue IgG responses and the graph at the bottom in green IgM responses. Bars represent the mean ± SD. C indicates blank control. Assays are performed in the same session, and results are depicted at the same scale.

