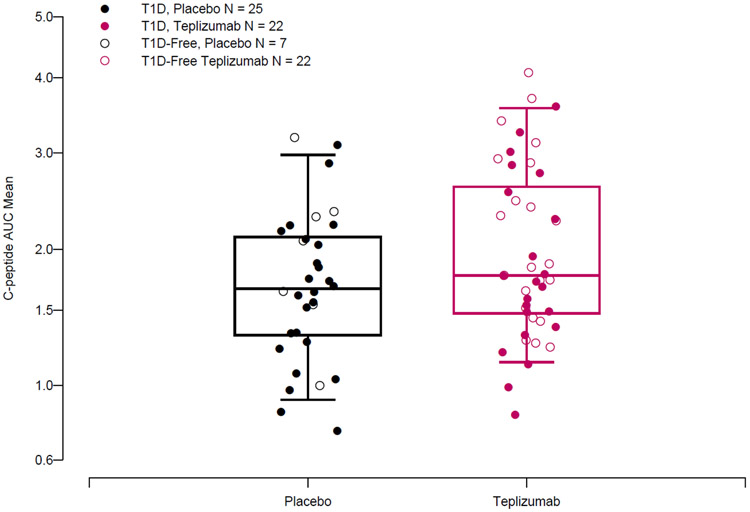
Figure 3. Teplizumab treatment was associated with increased average on-study C-peptide AUC.
Boxplot displaying median and interquartile ranges for average on-study OGTT C-peptide AUC mean for participants from placebo and teplizumab treated groups. An ANCOVA model including baseline C-peptide AUC and age showed that treatment was associated with higher average on-study C-peptide AUC (p=0.009).

