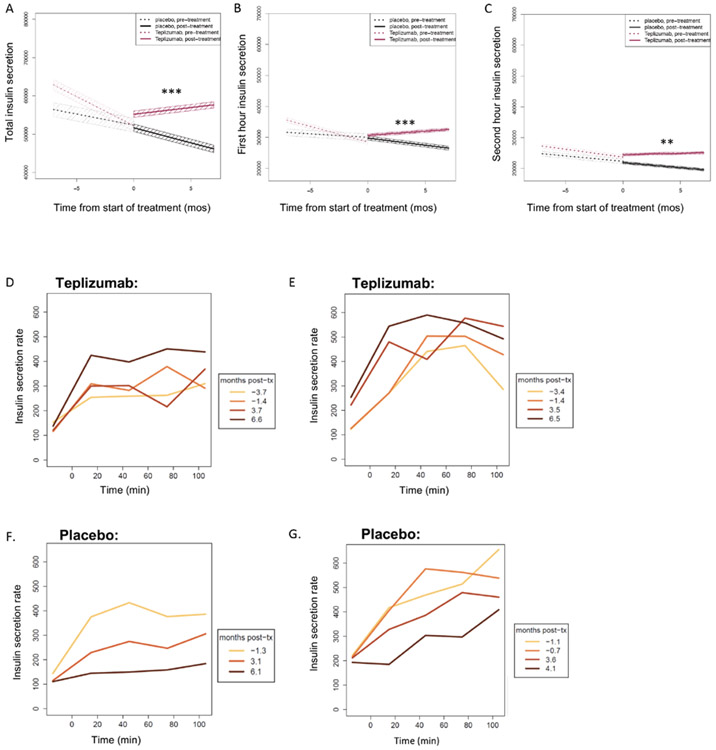
Figure 5. Insulin secretion after treatment with teplizumab or placebo.
Estimated slopes for the insulin secreted (pmol) during the total (A), first hour (B), and second hour (C) of the OGTT at the visits before enrollment and over the first 6 months after study drug treatment. Median values (and 95% confidence intervals in shaded colors) are shown. Significance for Wilcoxon signed-rank test for comparison of posttreatment slopes between treatment groups are shown in each panel. Please refer to Table 1 for full statistical analyses. (D and E) Representative insulin secretion rates during serial OGTTs for two teplizumab-treated participants who were not diagnosed with T1D (aged 11 and 12 years) and (F and G) two placebo-treated individuals (both aged 13 years) who were diagnosed with T1D. The colored lines indicate the time of the visits in relationship to study drug administration. tx, treatment. **P < 0.01 and ***P < 0.001.

