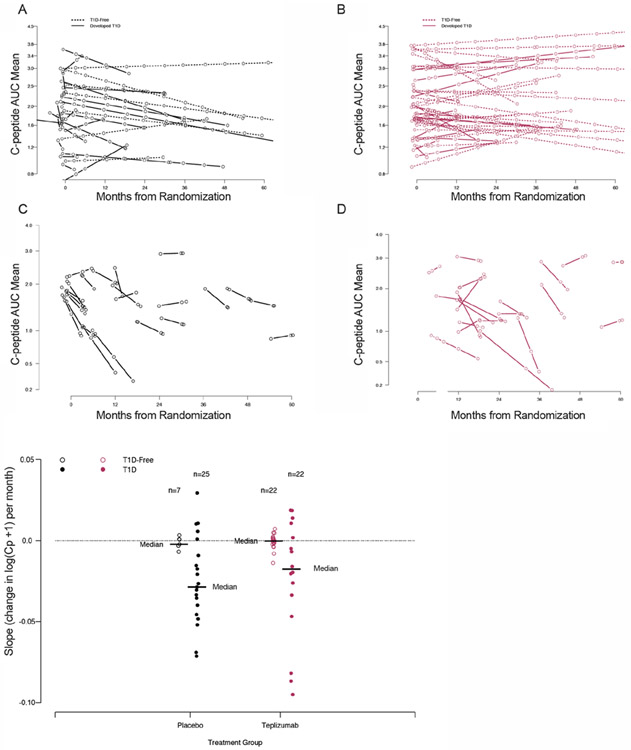
Figure 6. Teplizumab preserves C-peptide over the course of the study until the period surrounding diagnosis.
For all panels, data from teplizumab-treated participants are shown in blue, and placebo-treated participants are shown in maroon. A,B. Regression lines for C-peptide AUC values over the study period of OGTT monitoring from baseline study visit until diagnosis (teplizumab n=44, placebo n=32). C,D. Regression lines for C-peptide AUC values over 6 month period before diabetes diagnosis (placebo n=23, teplizumab n=22). E. Slopes of C-peptide AUC for 6-month period before diagnosis in those that developed T1D, and the last 6 months of study in individuals remaining T1D-free.

