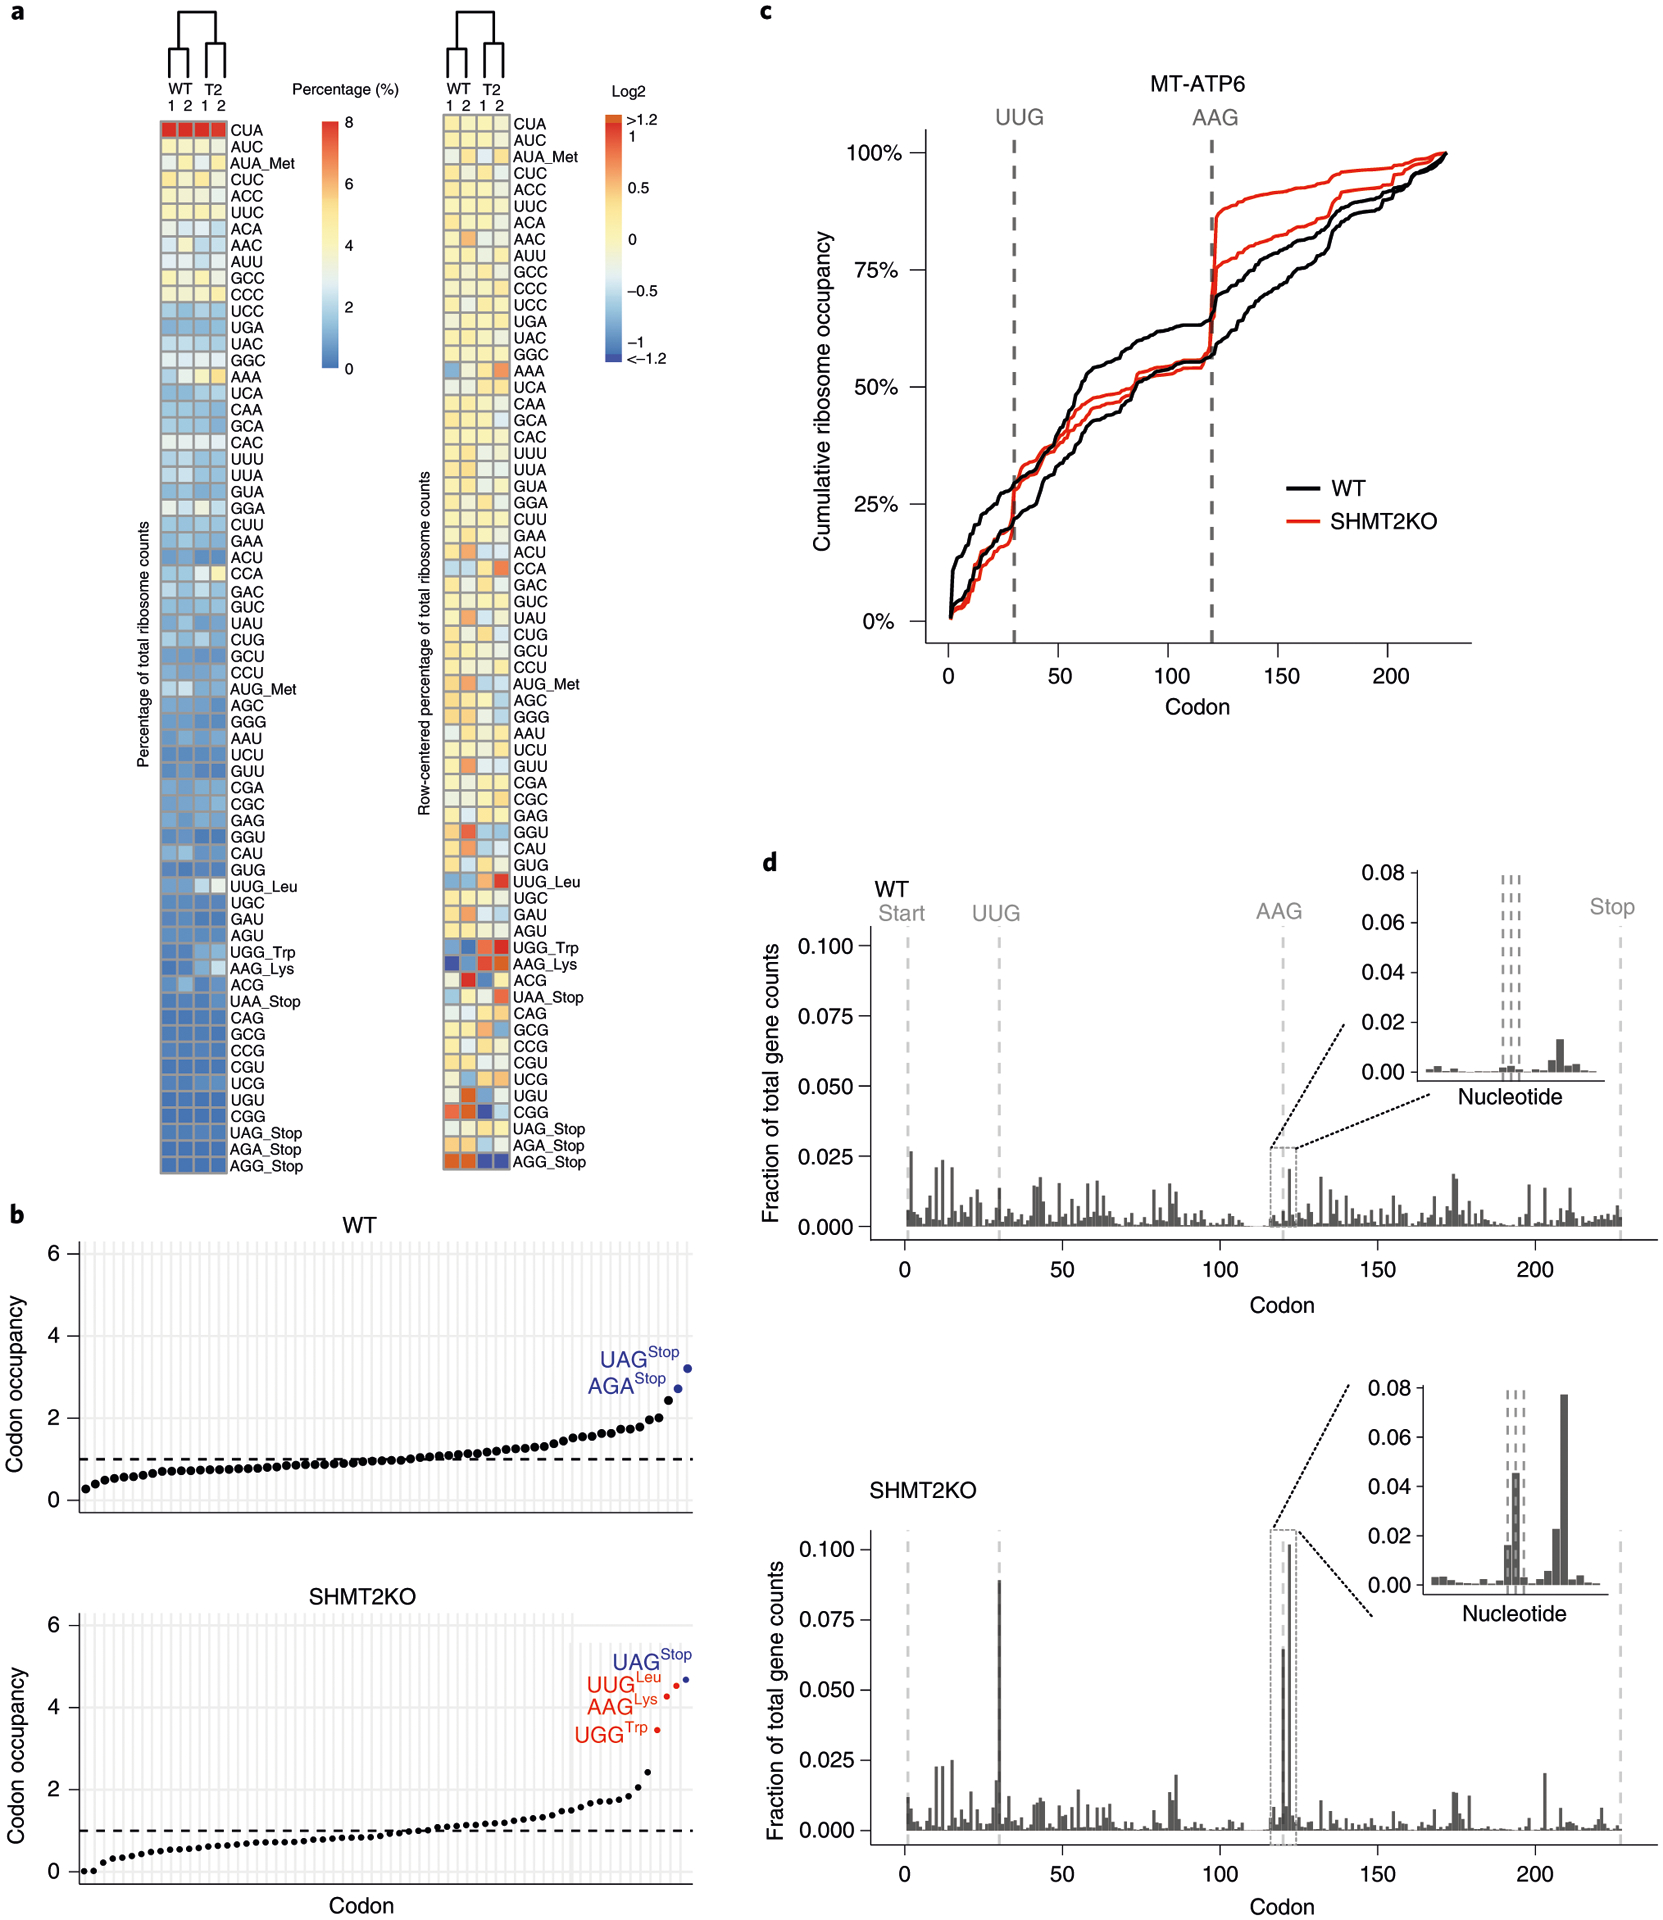
Fig. 7 |. Typical analysis results of MitoRiboSeq from HCT116 cells in wild type (WT) and SHMT2 KO mutant.

a, Clustering results of codon counts. The columns represent biological replicates and conditions, while the rows are organized by decreasing codon frequency in the mitochondrial genome. The heat map on the right is row-mean centered. b, Codon occupancy of wild type and SHMT2 KO. The colors indicate the codon type. Blue: stop codon; red: stalling sites. c, Normalized cumulative ribosome counts along the transcript of MT-ATP6 from two biological replicates from each condition. The vertical lines highlight the AAG and UUG codons. d, Fraction of codon counts along the transcript of MT-ATP6. The vertical lines highlight the start, stop, AAG and UUG codons. The inlet highlights the ribosome counts at nucleotide level around the AAG.
