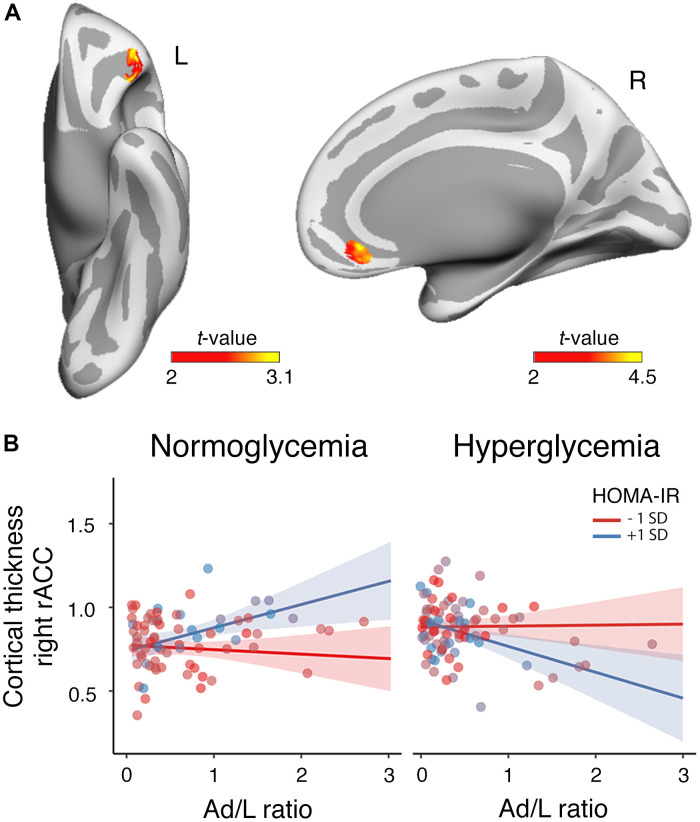
Figure 2.
Moderating role of HOMA-IR and glycemia in the association between the Ad/L ratio and cortical thickness. (A) Results of the three-way interaction (Ad/L ratio × HOMA-IR × glycemia) after adjustment for the remaining MtbS components, CRF, BMI, age, sex and years of education. Significant t statistic values were projected into the inflated cortical surfaces (L: left; R: right). (B) Scatterplot to represent the post-hoc of the three-way interaction effect shown in panel (A). It shows the association of the Ad/L ratio with cortical thickness in the rostral anterior cingulate (rACC) of the right hemisphere at 1 SD below and above the mean of HOMA-IR for participants showing normal blood glucose levels (left panel) and hyperglycemia (right panel). The shaded areas reflect the confidence intervals (95%) for the fitted values.

