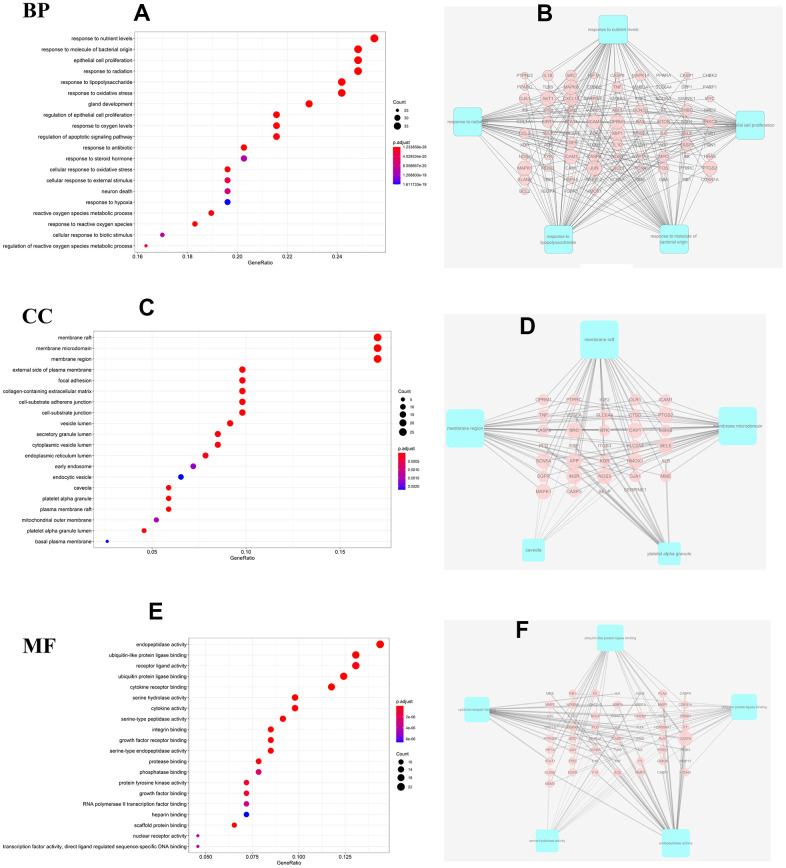
Figure 5.
GO analysis for the major targets of JDTL. (A) Bar chart of biological process categories; (B) Sub-network showing the top 5 BP terms and related genes. (C) Bar chart of cellular composition categories; (D) Sub-network showing the top 5 CC terms and related genes; (E) Bar chart of molecular function categories; (F) Sub-network showing the top 5 MF terms and related genes (P<0.05).

