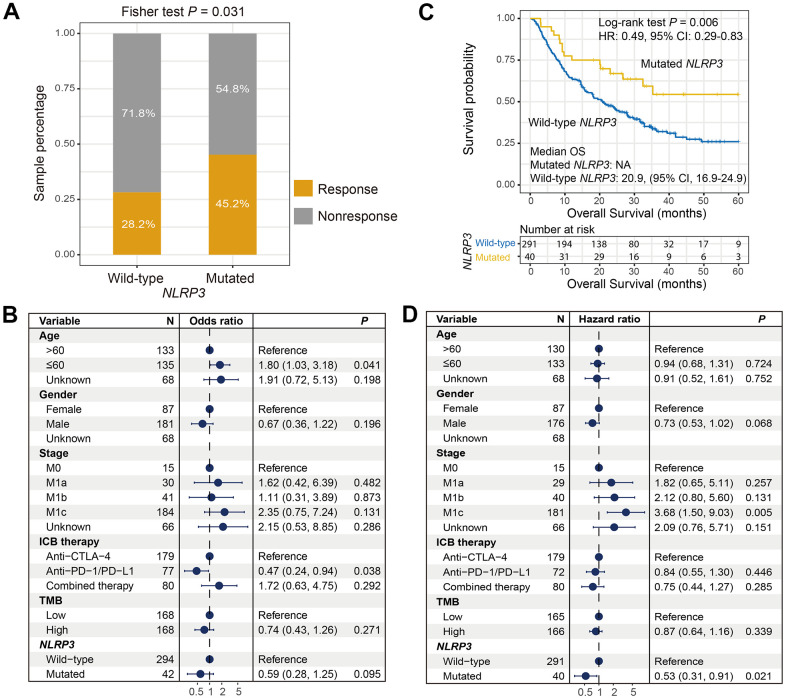
Figure 4.
Correlation of NLRP3 mutations with ICI response rate and survival interval. (A) Distinct ICI response rate in NLRP3 mutated and wild-type patients. (B) Association of NLRP3 mutations with the response rate in multivariate Logistic regression model. (C) Kaplan-Meier survival curve of distinct NLRP3 status in ICI-treated cohort. (D) Forest plot for multivariate Cox regression model with confounders taken into account.

