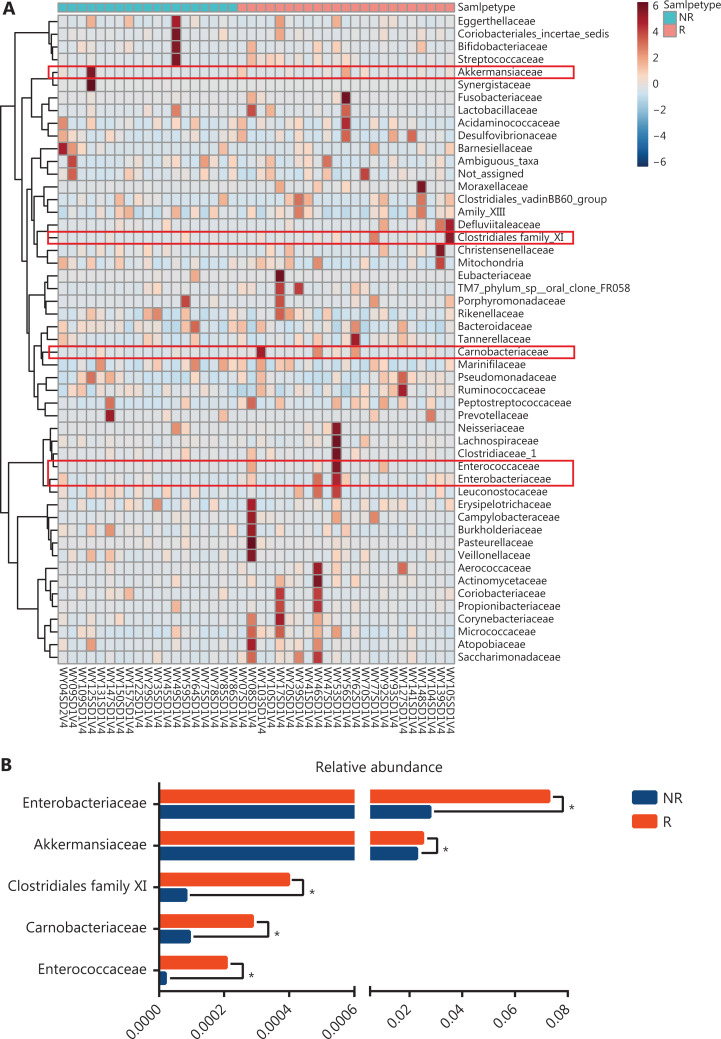
Figure 4.
Comparison of the gut microbiota at the family level between responders (R, n = 23) and nonresponders (NR, n = 19). (A) Heat map visualization of gut microbiota at the family level prior to anti-PD-1 treatment. Columns represent individual patients clustered using hierarchical clustering with Euclidean distances. (B) Five bacterial families had significantly different abundances at baseline. Statistical analyses were performed using the Mann-Whitney test. *P < 0.05.

