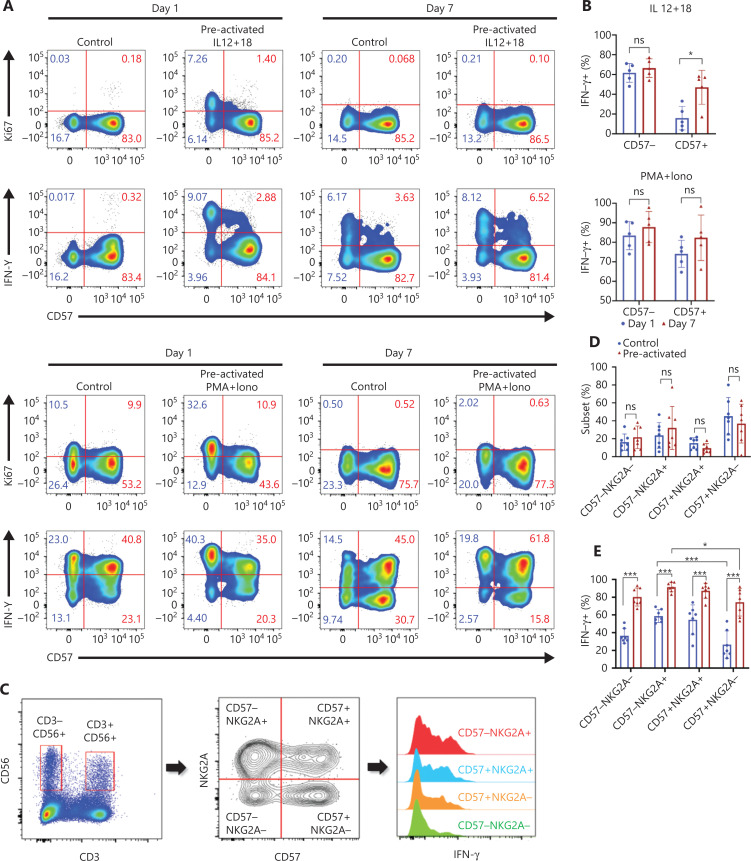
Figure 2.
CD57- and NKG2A-defined NK subsets show phenotypes of trained immunity. (A) Upper panel: representative flow cytometry plots of the percentages of Ki67+ or IFN-γ+ cell populations in NK cells stimulated with IL-12/15/18 for 16 h on day 0 and restimulated with IL-12/18 on day 7; lower panel: PMA+ionomycin restimulated cells on day 7 to obtain positive controls. Data are representative of 3 independent experiments. (B) Upper panel: summary bar graph showing the percentage of IFN-γ+ cells in the CD57− and CD57+ NK subsets in the upper panel of (A); Lower panel: summary bar graph showing the percentage of IFN-γ+ cells in the CD57− and CD57+ NK subsets in the lower panel of (A). (C) Flow cytometry plot of the gating strategy for CD3−CD56+ NK cell subsets. NK cells were stained with NKG2A, CD57, and IFN-γ, and grouped into 4 subsets according to NKG2A and CD57 for IFN-γ expression analysis. (D, E) Summary data showing the percentage of each of the 4 NK cell subsets (D) and the percentage of IFN-γ+ NK cells (E) in the control and preactivated groups on day 7 of in vitro culture. For all experiments, n = 5–7, *P < 0.05, **P < 0.01, and ***P < 0.001 (error bars, mean ± SEM). Data are representative of at least 3 independent experiments.

