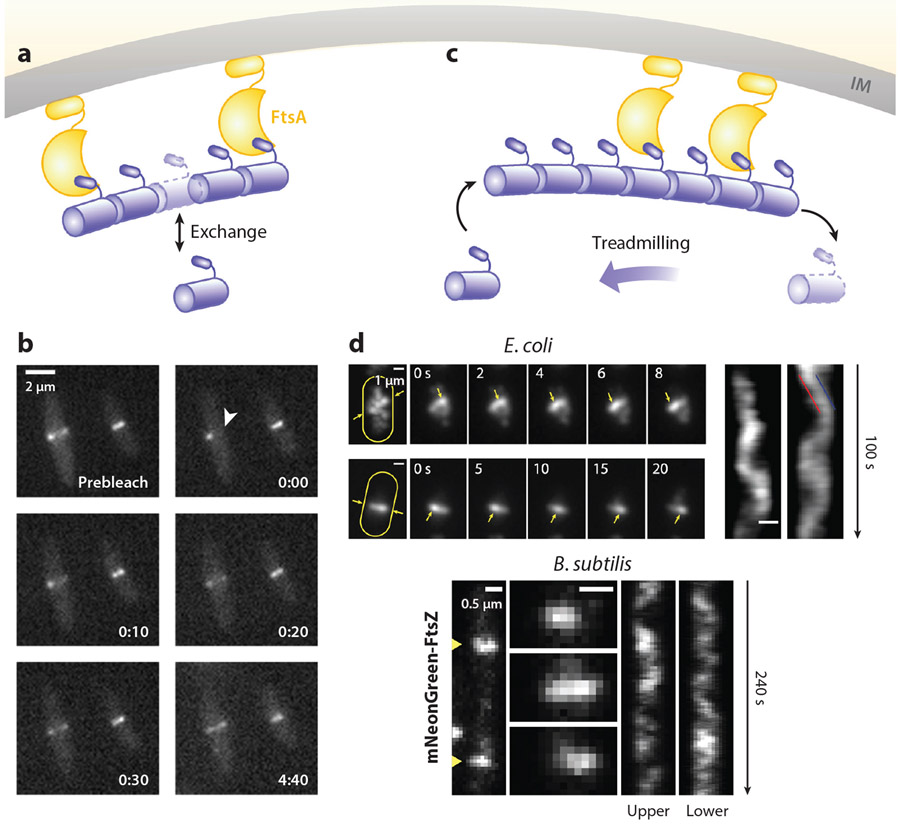
Figure 5.
Z-ring dynamics. (a) Schematic of the subunit exchange dynamics of the Z-ring. (b) A FRAP imaging sequence showing the rapid recovery of fluorescence after the photobleaching of half of the Z-ring (white arrowhead) (205). (c) Schematic of the treadmilling dynamics of the Z-ring. (d) Treadmilling dynamics observed in Escherichia coli (top) (239) and Bacillus subtilis (bottom) (20). For E. coli, the maximum intensity projections (left), the montages (middle), and the corresponding kymographs (right) of Z-rings labeled with FtsZ–green fluorescent protein (GFP) in two cells are shown. For B. subtilis, two FtsZ–mNeonGreen-labeled Z-rings (left), montages at 8-s intervals (middle), and the corresponding kymographs (right) of two cells are shown. Abbreviations: FRAP, fluorescence recovery after photobleaching; IM, inner membrane.

