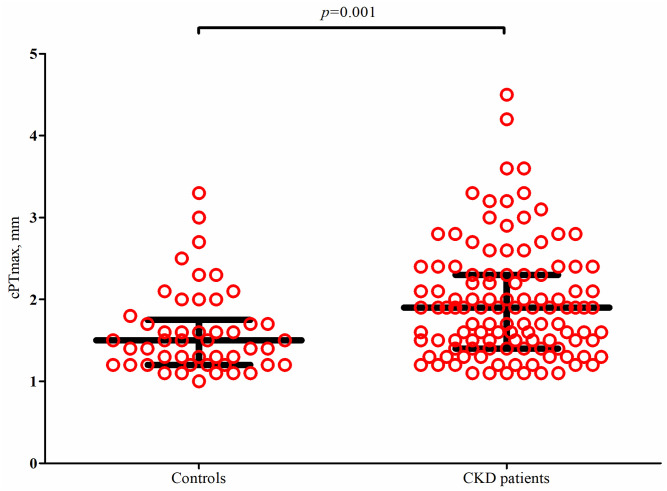
Fig 2. Distribution of maximal carotid plaque thickness (cPTmax) in patients with CKD stage 3 and controls.
Includes only participants with plaques (115/200 patients and 48/121 controls). Dot plot with median (long black horizonal line) and interquartiles (short black horizontal lines). The p-value is from a Mann-Whitney U-test.

