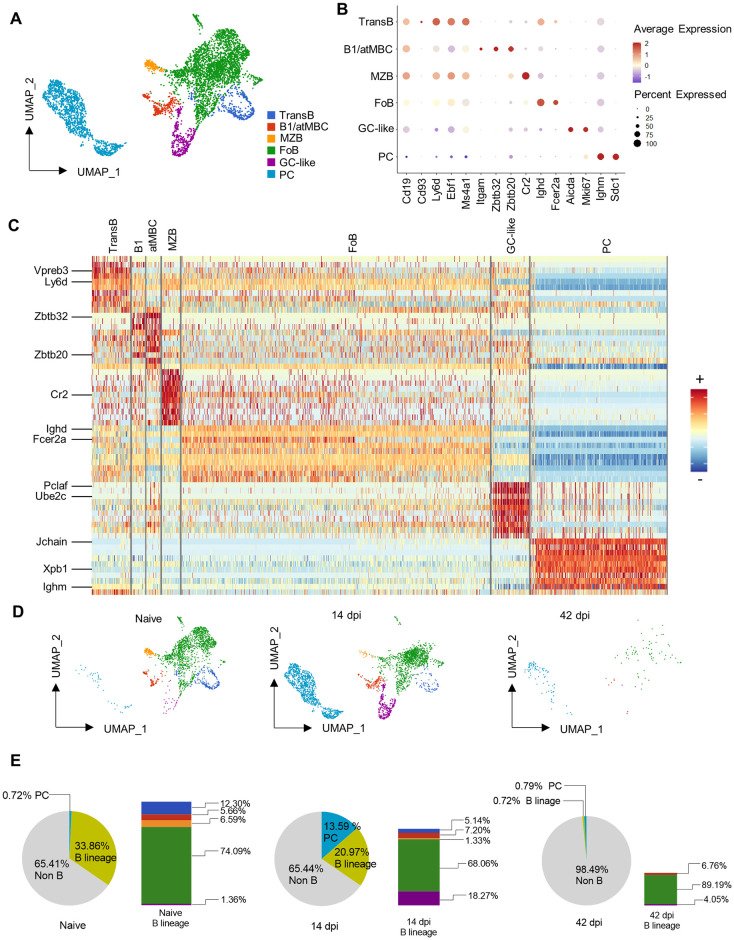
Fig 2. Transcriptomic analysis reveals T. evansi induced terminal B cell differentiation.
(A) Uniform Manifold Approximation and Projection (UMAP) of B cells colored by annotated cell type. TransB: Transitional B cells, B1/atMBC: B1 cells/atypical Memory B cells, MZB: Marginal Zone B cells, FoB: Follicular B cells, GC-like: Germinal center-like B cells, PC: Plasma cells. (B) Gene expression of main gene markers used for annotating B cells. (C) Heatmap of combined 10 highest differential expressed genes (Wilcoxon Rank Sum test, Seurat) per each cell population. Only major genes are highlighted. See S4 Fig for full gene labeled list. (D) UMAP Split view of B cell populations across 3 time points. Color code corresponds to (A). (E) Pie charts: Percentage of each population in total splenocytes. Grey: Non-B cells, Bright Yellow-Green: B lineage, Blue: Plasma cells. Bar graphs: Percentage of each B cell population in total splenic B cell lineage, colors correspond to (A).

