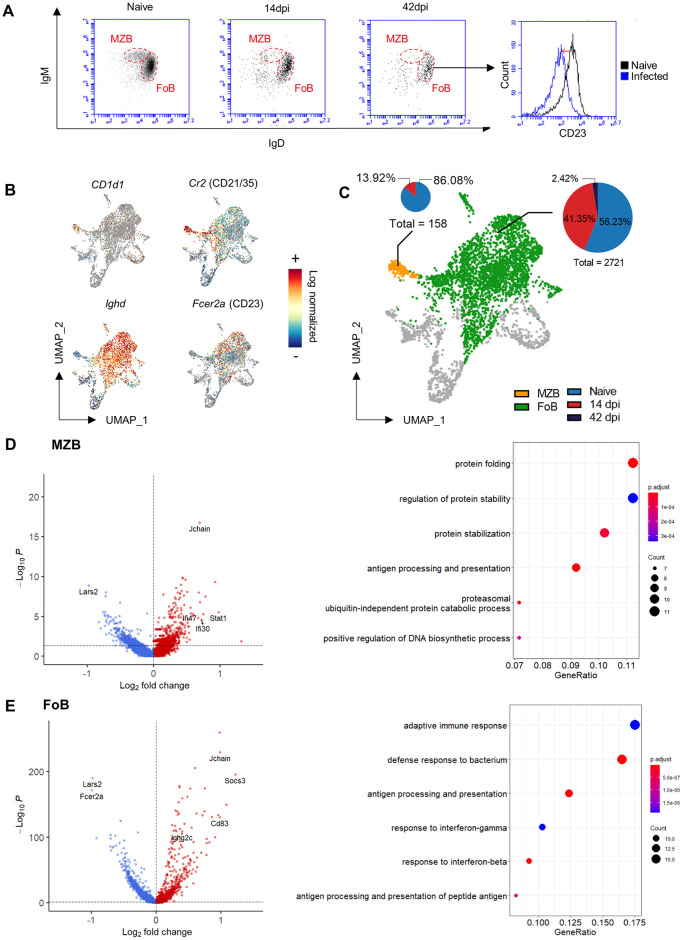
Fig 3. Differential gene expression analysis of MZBs and FoB during T. evansi infection.
(A) IgM/IgD flow cytometry profile of MZB and FoB during infection (left panels) and FoB-CD23 expression histogram plot during infection (right panel). One representative data set of 9 individual measurements is shown. (B) Log normalized expression of Cd1d1, Cr2, Ighd, and Fcer2a in spleen B cell populations in UMAP projection. (C) MZB and FoB populations UMAP visualization, with proportional pie-chart representation of population at 3 different time points. Pie-chart diameters are normalized for each population size. (D-E) Left panels: Differential gene expression analysis of MZB/FoB at 14dpi versus Naïve. Dash lines display cut-off of P value (0.05). Right panels: Gene ontology analysis of top 100 differential expressed genes of MZB/FoB at 14dpi.

