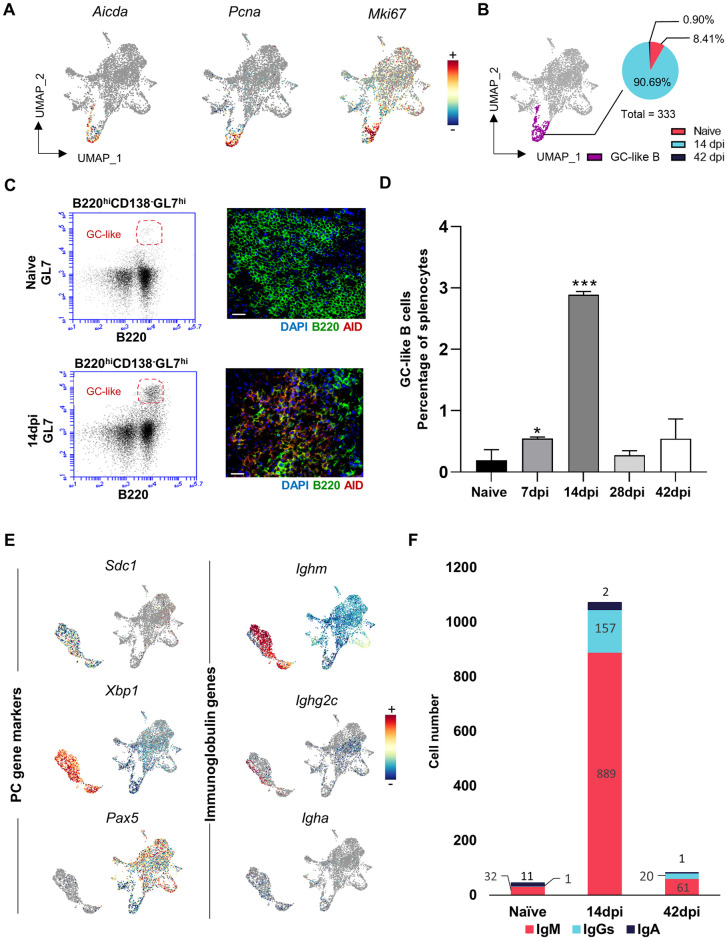
Fig 5. Rapid formation of GC-like B cells and PCs results in decline of cell numbers later during infection.
(A) UMAP projection of B cells colored based on log normalized expression of Aicda, Pcna and Mki67. (B) GC-like B cells UMAP visualization, with proportional pie-chart representation of population at 3 different time points. (C) GL7/B220 flow cytometry analysis (left) and AID/B220 immunohistochemistry of infection-induced GC-like B cells at 14dpi. Scale bar indicate 20 μm. (D) Percentage of GC-like B cells in splenocytes during T. evansi infection, analyzed by flow cytometry analysis. Data is shown as mean + SD of three independent samples, from one of three representative experiments, with significant differences versus naïve controls. * p≤0.05; ** p≤0.01; *** p≤ 0.001 by Student’s t-test. (E) B cells and PCs colored based on log normalized expression of Sdc1, Xbp1, Pax5 (left) and Ighm, Ighg2c, Igha (right). (F) Distribution of splenic IgM+ PCs, IgGs+ PCs, and IgA+ PCs at 3 different time points.

