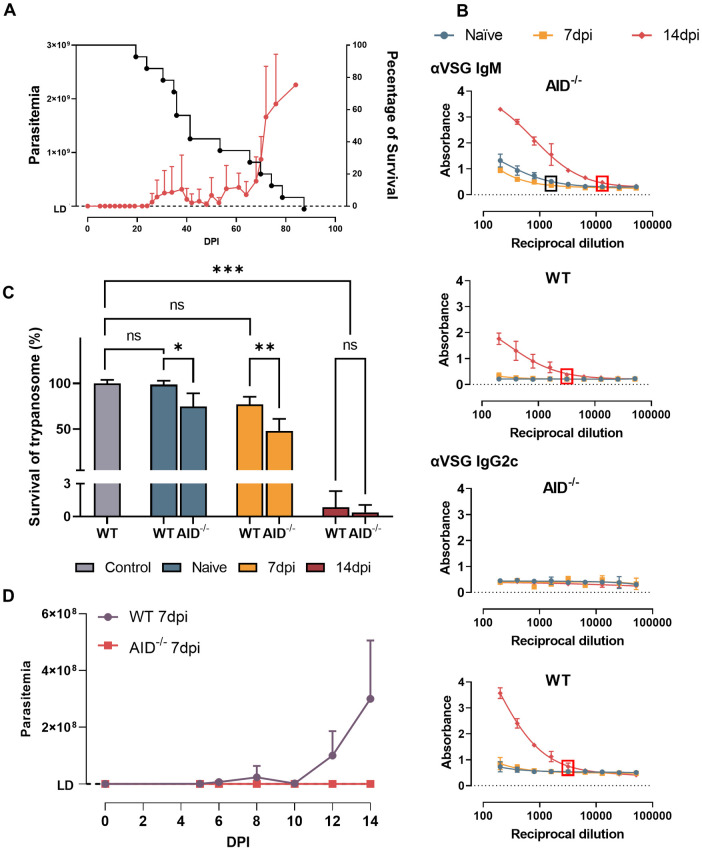
Fig 6. AID-/- infected mice exhibit superior trypanosomosis control.
(A) Parasitemia and survival of T. evansi infected AID-/- mice (means + SD of 15 mice, combining 3 independent experiments). The Left Y axis indicates the number of parasites while the right Y axis indicating percentage of survival. LD: detection limit (2x10⁵ parasites/ml). (B) Anti-VSG IgM and IgG2c isotype serum antibody titers in infected AID-/- and WT mice (right). The box highlights the end point titer (black = naïve and 7dpi, red = 14dpi). (C) In vitro trypanocidal activity of AID-/- and WT mice plasma at different time points. Control bar indicate survival of trypanosome in HMI9 media without plasma incubation. * p≤0.05; ** p≤0.01; *** p≤ 0.001; ns: non-significant by One-way ANOVA followed by multiple comparisons. (D) Anti-trypanosome activity of AID-/- and WT 7dpi mice plasma after transfer to WT mice 3 days after infection. LD: detection limit. (B-C) Data is represented as means + SD of three individual samples, in one of three representative experiments.

