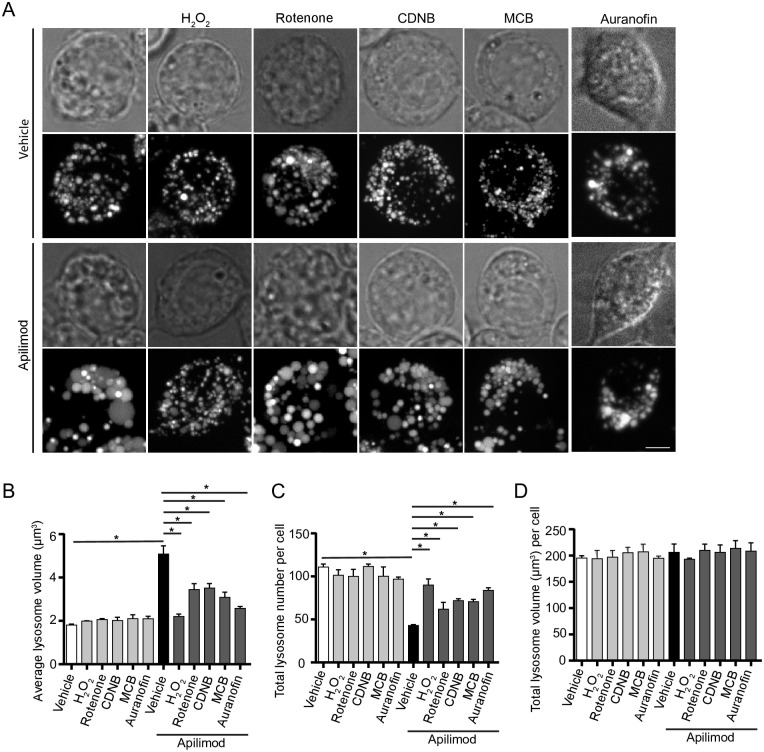
Fig 2. ROS agonists prevent lysosome enlargement during acute PIKfyve suppression.
A: RAW cells pre-labelled with Lucifer yellow and exposed to vehicle or 20 nM apilimod for 40 min. These conditions were then supplemented with additional vehicle or 1 mM H2O2 for 40 min, 1 μM rotenone for 60 min, 10 μM CDNB for 30 min, 5 μM MCB for 30 min or auranofin 10 μM for 120 min. Fluorescence micrographs are represented as z-projections of 45–55 z-plane images obtained by spinning disc microscopy. Scale bar: 5 μm. B-D: Quantification of individual lysosome volume (B), lysosome number per cell (C), and total lysosome volume per cell (D). Data represent mean ± S.E.M. from three independent experiments, with 25–30 cells assessed per treatment condition per experiment. One-way ANOVA and Tukey’s post-hoc test was used, where * indicates statistical significance between indicated conditions (p<0.05).

