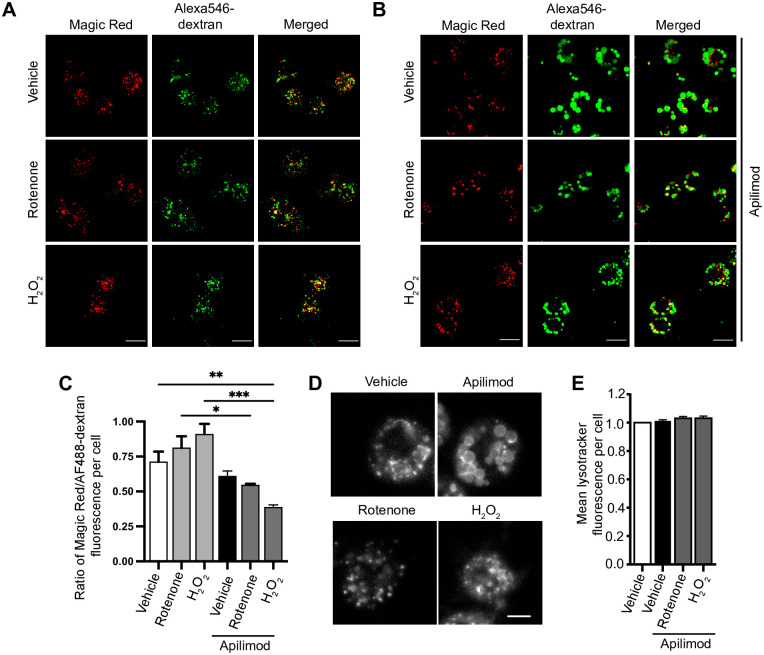
Fig 10. Measurement of lysosome proteolytic and acidic functions in response to PIKfyve inhibition and ROS.
(A, B) RAW cells loaded with Alexa488-conjugated dextran to label lysosomes followed by treatment with vehicle, or 1 mM H2O2 for 40 min, or 1 μM rotenone for 60 min (A) or in combination with 20 nM apilimod for 40 min (B), and staining for lysosomal proteolytic function with Magic Red. Scale bar: 50 μm. (C) Quantification of Magic Red to Alexa488-dextran intensity ratio, where decreasing intensity ratio indicates reduced degradation. (D) RAW cells treated with vehicle or 20 nM apilimod for 40 min alone, or in combination with 1 μM rotenone for 60 min or 1 mM H2O2 for 40 min, and stained for LysoTracker Red as an indicator of lysosome acidification. Scale bar: 5 μm. (E) Quantification of mean lysotracker intensity per cell normalized to control cells. Data are represented as mean ± SEM from three independent experiments, with 40–50 cell assessed per treatment condition per experiment. One-way ANOVA and Tukey’s post-hoc test was used, where * indicates statistically significant difference between control conditions (P<0.05).

