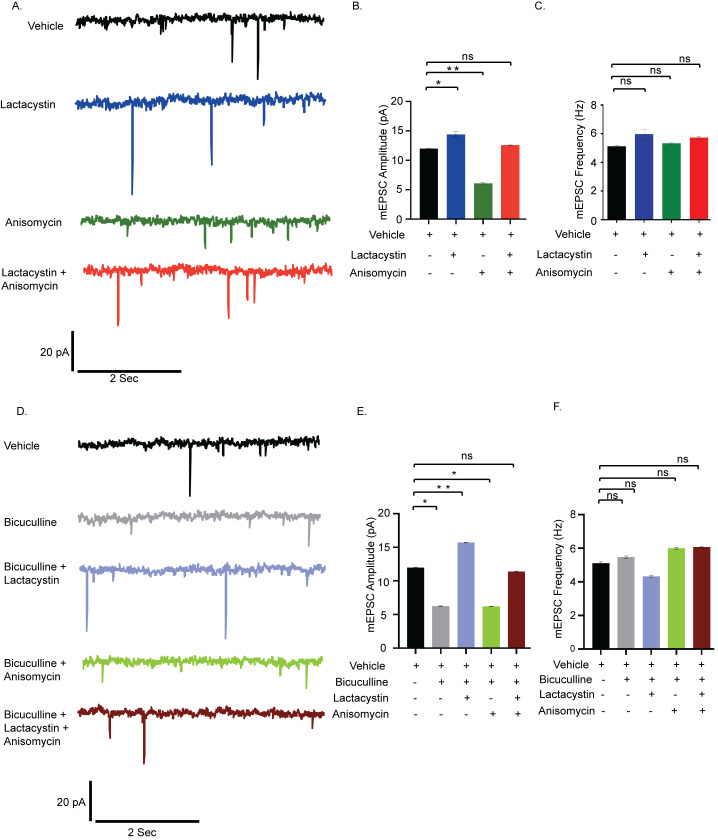
Fig 1. Synaptic scaling is coregulated by protein synthesis and degradation.
(A) mEPSC traces from hippocampal neurons treated with vehicle, lactacystin, anisomycin, and both. (B) Mean mEPSC amplitude. (C) Mean mEPSC frequency. n = 13–15. *p < 0.024, **p < 0.01. ns, not significant. Data shown as mean ± SEM. One-way ANOVA and Fisher’s LSD. Scale as indicated. (D) mEPSC traces from neurons treated with vehicle, bicuculline alone, or in combination with lactacystin and anisomycin. (E) Mean mEPSC amplitude. (F) Mean mEPSC frequency. n = 12–16. *p < 0.01, **p < 0.001. ns, not significant. Data shown as mean ± SEM. One-way ANOVA and Fisher’s LSD. Scale as indicated. The data underlying this figure are available at https://figshare.com/articles/dataset/Homeostatic_scaling_is_driven_by_a_translation-dependent_degradation_axis_that_recruits_miRISC_remodeling/16768816. mEPSC, miniature excitatory postsynaptic current; ns, not significant.

