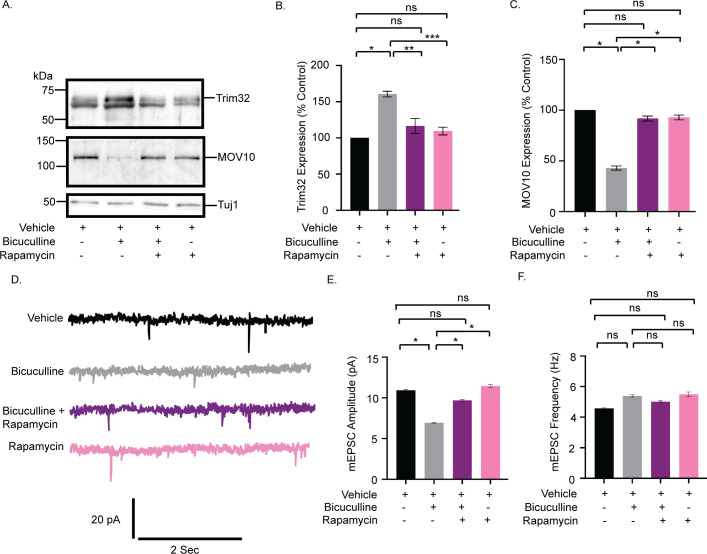
Fig 7. mTORC1 drives Trim32 synthesis and consequent MOV10 degradation during synaptic downscaling.
(A) Western blot analysis from neurons treated with bicuculline, rapamycin, or both showing the expression levels of Trim32, MOV10, and Tuj1. (B) Quantitation of Trim32 expression. (C) Quantitation of MOV10 expression. Data shown as mean ± SEM. n = 5. *p < 0.0001, **p < 0.0007, ***p < 0.0001 (B) and *p < 0.001 (C). ns, not significant. One-way ANOVA and Bonferroni’s correction. (D) mEPSC traces from neurons treated with vehicle, bicuculline, rapamycin, or both. (E) Mean mEPSC amplitude. (F) Mean mEPSC frequency. n = 8–9. *p < 0.01. ns, not significant. Data shown as mean ± SEM. One-way ANOVA and Fisher’s LSD. The data underlying this figure are available at https://figshare.com/articles/dataset/Homeostatic_scaling_is_driven_by_a_translation-dependent_degradation_axis_that_recruits_miRISC_remodeling/16768816. mEPSC, miniature excitatory postsynaptic current; mTORC1, mammalian Target Of Rapamycin Complex-1; ns, not significant.

