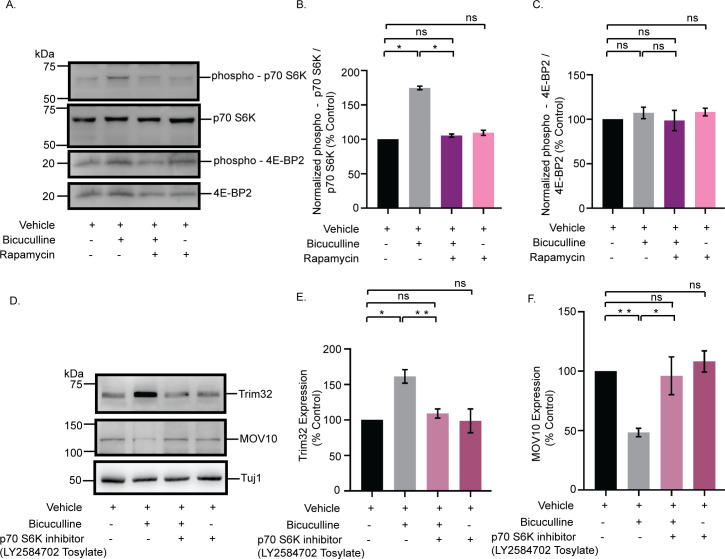
Fig 8. mTORC1 regulates the Trim32-MOV10 axis via the phosphorylation of p70 S6K.
(A) Western blot analysis from neurons treated with bicuculline, rapamycin, or both showing the phosphorylation and total expression of p70 S6K and 4E-BP2. (B) Quantitation of p70 S6K phosphorylation. (C) Quantitation of 4E-BP2 phosphorylation. n = 4. *p < 0.0001. ns, not significant. Data shown as mean ± SEM. One-way ANOVA and Fisher’s LSD. (D) Western blot analysis from neurons treated with bicuculline, p70 S6K inhibitor LY2584702 Tosylate, or both, showing the expression of MOV10 and Trim32. (E) Quantitation of Trim32 expression. (F) Quantitation of MOV10 expression. n = 5. *p < 0.003, **p < 0.0002 (E) **p < 0.0001, *p < 0.02 (F). ns, not significant. Data shown as mean ± SEM. One-way ANOVA and Fisher’s LSD. The data underlying this figure are available at https://figshare.com/articles/dataset/Homeostatic_scaling_is_driven_by_a_translation-dependent_degradation_axis_that_recruits_miRISC_remodeling/16768816. mTORC1, mammalian Target Of Rapamycin Complex-1; ns, not significant; p70 S6K, p70 S6 kinase; 4E-BP2, 4E-binding protein 2.

