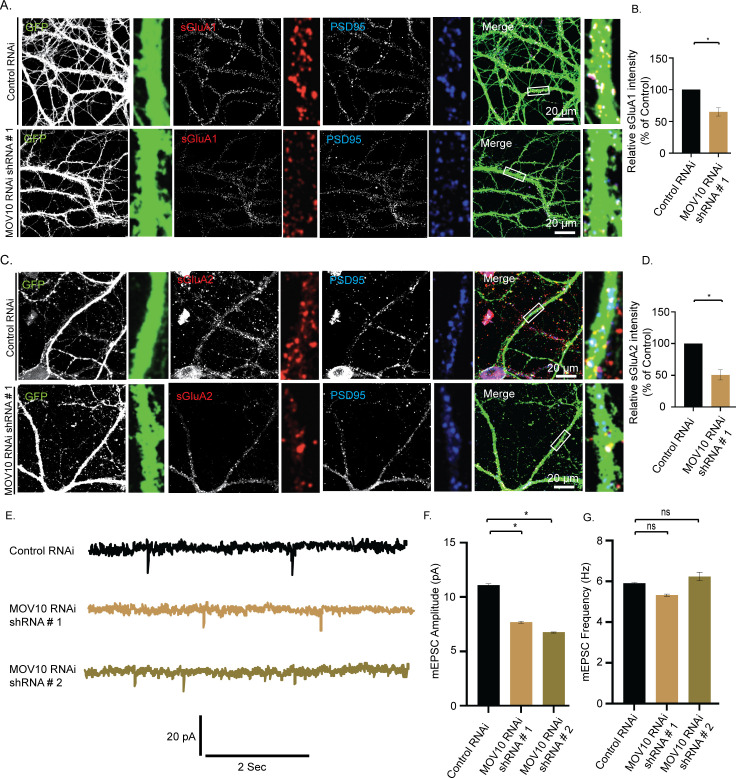
Fig 9. MOV10 modulates the abundance of sAMPARs during synaptic downscaling.
High-magnification images of neurons transduced with lentivirus coexpressing EGFP and shRNA against MOV10 (MOV10 RNAi) or nontargeting shRNA (Control RNAi) showing the expression of sGluA1 or sGluA2. (A) Control RNAi and MOV10 RNAi neurons showing sGluA1 (red), PSD95 (blue), GFP (green), and GFP/sGluA1/PSD95 (merged). (B) Quantitation of normalized intensity of synaptic sGluA1. (C) Control RNAi and MOV10 RNAi neurons showing sGluA2 (red), PSD95 (blue), GFP (green), and GFP/sGluA2/PSD95 (merged). (D) Quantitation of normalized intensity of synaptic sGluA2. n = 26–30, GluA1; n = 12–15, GluA2. Data shown as mean ± SEM. *p < 0.01. One-way ANOVA and Fisher’s LSD. Dendrite marked in white box was digitally amplified. See also S4 Fig. (E) mEPSC traces from neurons transduced with shRNAs against MOV10 or control shRNA. (F) Mean mEPSC amplitude. (G) Mean mEPSC frequency. n = 12–13. *p < 0.01. ns, not significant. Data shown as mean ± SEM. One-way ANOVA and Fisher’s LSD. The data underlying this figure are available at https://figshare.com/articles/dataset/Homeostatic_scaling_is_driven_by_a_translation-dependent_degradation_axis_that_recruits_miRISC_remodeling/16768816. mEPSC, miniature excitatory postsynaptic current; ns, not significant; sAMPAR, surface AMPAR.

