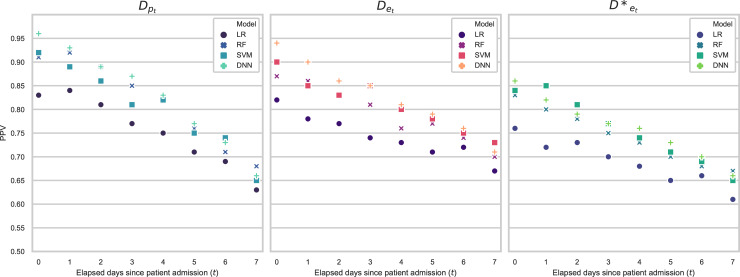
Fig 3. PPV results.
Scatter plots giving the PPV, calculated for the 20% of patients with the highest positive classification scores, for LR, RF, SVM and DNN models, trained and tested on the different sub-datasets which reflect the patient cohorts at different points in their hospital stays. Planned admissions are represented by Dpt, emergency admissions Det and emergency admissions with an infectious disease D*et.

