. 2021 Nov 23;10:e72881. doi: 10.7554/eLife.72881

Figure 2. Migrating follicle cells have long-lived, treadmilling stress fibers (SFs).

(A) Image of one cell showing that myosin regulatory light chain (MRLC-GFP) labels SFs, but not leading-edge protrusions. Image shown is representative of five egg chambers. See Figure 2—figure supplement 1 for comparison of live actin labels. Still images from videos showing an SF (B) forming by MRLC-GFP coalescence (n = 64 SF appearances), and (C) disappearing by collapsing from the rear (n = 75 SF disappearances). Quantification of SF lifetimes. (D) Half-life measurement in real time. (E) Lifetimes as a function of how long it took the cell to migrate one cell length. n = 91 SFs from 23 cells in 3 egg chambers. Bars in (E) show median and interquartile ranges. (F) Still images from a video of an optically isolated cell showing an SF tip growing as the cell migrates (arrow). Cell outlines are drawn from CellMask membrane label. See Figure 2—video 1; Figure 2—video 2, and Figure 2—figure supplement 2 for images of the original membrane label and an optically isolated single SF. (G, H) Temporal projections of SFs from the cell in (F). (G) Shows the same period as (F) at 20-s intervals. (H) Shows the period required for the cell to migrate ~1 cell length. Experiments performed at stage 7. Black arrows show migration direction. Scale bars: 5 µm (A, F), 1 µm (B, C).

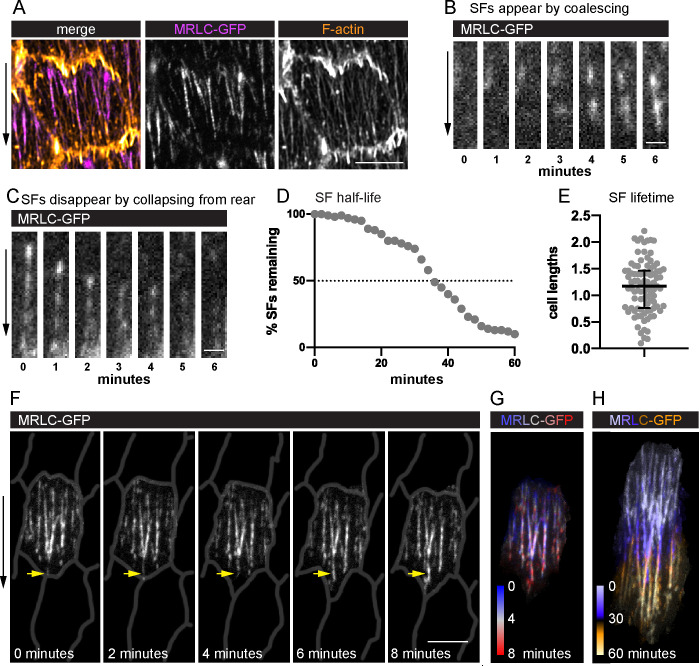
Figure 2—source data 1. Excel file containing the numeric data used to generate the graphs in Figure 2.
Each tab on the spreadsheet corresponds to one graph.

Figure 2.

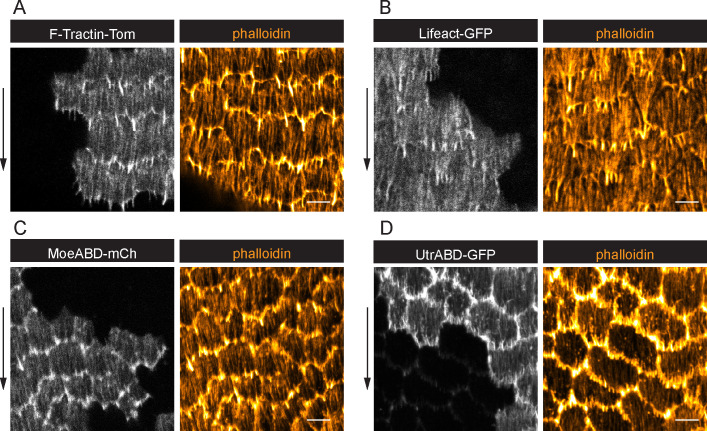
Figure 2—figure supplement 1. Treadmilling stress fibers (SFs) marked with live F-actin labels.

Figure 2—figure supplement 1.

(A–D) Images of epithelia with clones of cells expressing live F-actin labels. In all cases, labeling of leading-edge protrusions obscures the ends of the SFs. LifeAct and Utr-ABD (B, D) also significantly alter F-actin organization compared to wild-type cells stained with phalloidin. In D, very weak constitutive expression of Utr is seen outside of clones. Images shown are representative of n = 4, 6, 4, 8 egg chambers. Experiments performed at stages 7 and 8. Arrows show migration direction. Scale bars: 5 µm.
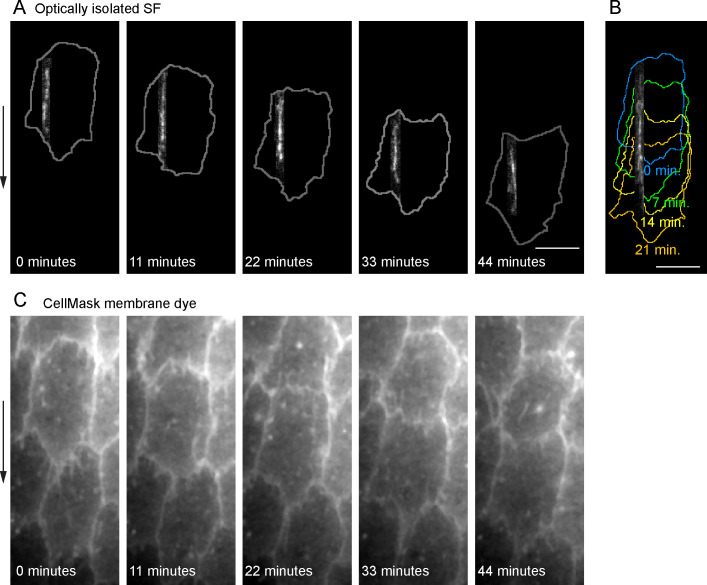
Figure 2—figure supplement 2. Treadmilling of an optically isolated stress fiber (SF).

Figure 2—figure supplement 2.

(A) Still images from a video showing an optically isolated SF over 44 min; cell outlines are shown in gray. (B) Maximal projection of the same SF as in (Figure 2F), shown over 21 min; colored cell outlines correspond to time intervals shown. (C) Still images from a video showing the original membrane label for Figure 2F. Experiments performed at stages 7 and 8. Arrows show migration direction. Scale bars: 5 µm.
Figure 2—video 1. Time-lapse video of a field of follicle cells with plasma membranes labeled with CellMask and stress fibers (SFs) labeled with myosin regulatory light chain (MRLC)-GFP.
Download video file (4.3MB, mp4)
Note that individual SFs persist as the cells migrate. Near total internal reflection fluorescence microscopy (near-TIRFM), recorded with Nikon ECLIPSE-Ti with 20-s imaging interval. Playback rate 30 frames/s. Related to Figure 2F.
Figure 2—video 2. Time-lapse video of an optically isolated follicle cell with stress fibers (SFs) labeled with myosin regulatory light chain (MRLC)-GFP.
Download video file (243KB, mp4)
Note MRLC-GFP being added to the tips of existing SFs as the cell migrates. Near total internal reflection fluorescence microscopy (near-TIRFM), recorded with Nikon ECLIPSE-Ti with 20-s imaging interval. Playback rate 30 frames/s. Related to Figure 2F.