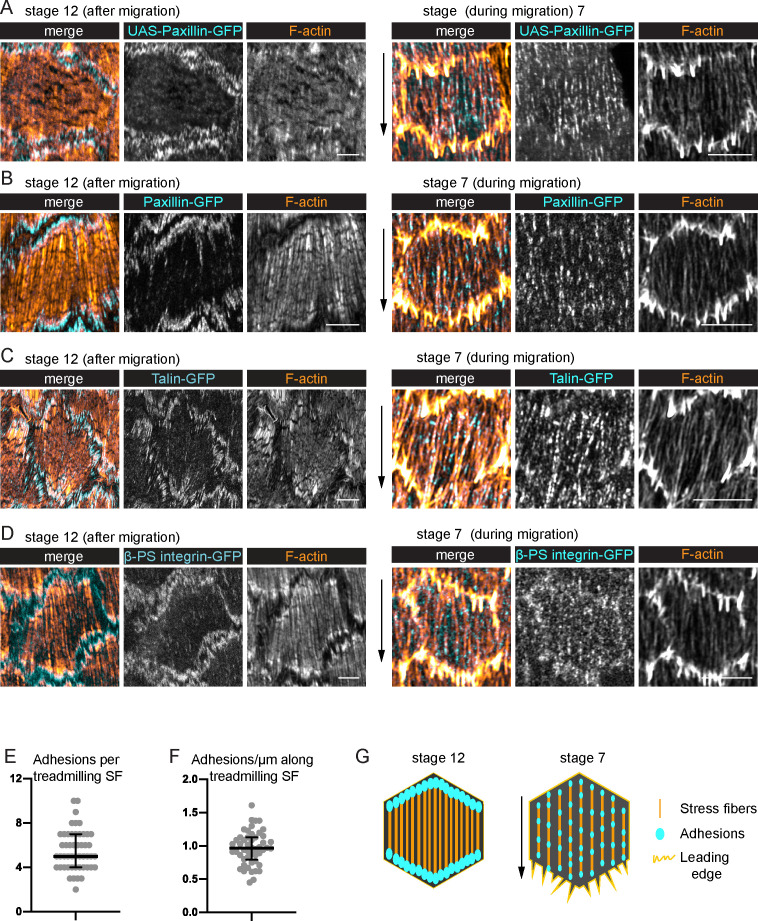
Figure 3. Treadmilling stress fibers (SFs) have many adhesions along their lengths.
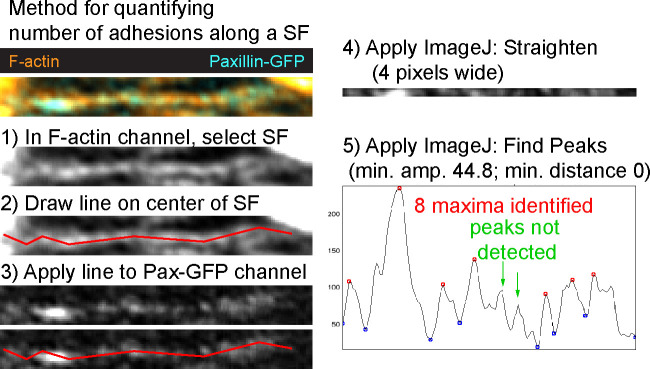
(A–D) Images of SFs in single cells with adhesions labeled. After migration stops, there are large adhesions at the ends of the SFs. During migration, there are many smaller adhesions along their lengths. (A) UAS-Paxillin-GFP (images shown representative of 4 stage 12 and 3 stage 7). (B) Paxillin-GFP (n = 4, 5). (C) Talin-GFP (n = 3, 3). (D) βPS-integrin-GFP (n = 4, 3). (B–D) The GFP on the indicated protein is a functional, endogenous tag. (E, F) Quantification of the adhesions associated with individual SFs using Paxillin-GFP. (E) Number. (F) Linear density. n = 277 adhesions from 11 cells in five egg chambers. Bars show medians and interquartile ranges. See Figure 3—figure supplement 1 for method for counting adhesions. (G) Illustration of SF structure in postmigratory and migratory cells. Black arrows show migration direction. Scale bars: 5 µm.


