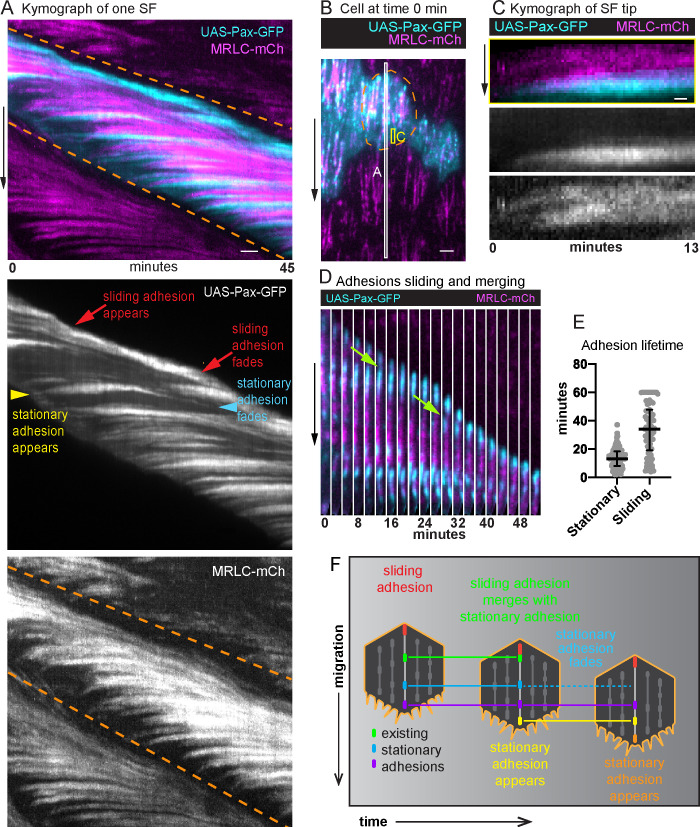
Figure 4. Adhesions are continuously added and removed from treadmilling stress fibers (SFs).
(A) Kymograph of one SF from the white boxed region in (B) showing the appearance and disappearance of adhesions and actomyosin segments over time. The orange dashed lines mark the leading and trailing edges of the cell, respectively, and their diagonal orientation indicates the movement of the cell edges over time. The yellow arrowhead marks the addition of a new adhesion to the front of the SF. The slight rearward curve at the front of the trace suggests that the adhesion matures under tension. The trace then remains largely horizontal showing that the adhesion is stationary relative to the substrate. The trace fades as the cell rear approaches, showing adhesion disassembly. The many horizontal traces show that multiple adhesions are added to the same SF over time. Finally, the red arrows highlight the appearance and disappearance of a distinct adhesion at the rear. The diagonal orientation of this trace indicates that the final adhesion moves with the cell’s trailing edge. The image shown is representative of kymographs for eight SFs. (B) Still image from a video of an epithelium in which all cells express myosin regulatory light chain (MRLC)-mCherry (mCh) and a subset of cells expresses UAS-Paxillin-GFP. Dashed line surrounds one cell. White and yellow boxes correspond to kymographs in (A) and (C), respectively. See Figure 4—video 1. (C) Kymograph of a SF tip from the yellow boxed region in (B), showing that Paxillin-GFP and MRLC-mCh levels increase in synchrony as the SF grows at the front. The image shown is representative of kymographs for seven SFs. (D) Still images from a video showing a sliding adhesion that persists for at least 50 min and merges with three stationary adhesions (green arrows). See Figure 4—video 2. (E) Quantification of adhesion lifetimes. In order on graph, n = 134, 84 adhesions from 23 cells in 3 egg chambers. Bars show medians and interquartile ranges. (F) Illustration summarizing adhesion dynamics in treadmilling SFs. Experiments performed at stage 7. Black arrows show migration direction. Scale bars: 2 µm (A, B), 0.5 µm (C).

