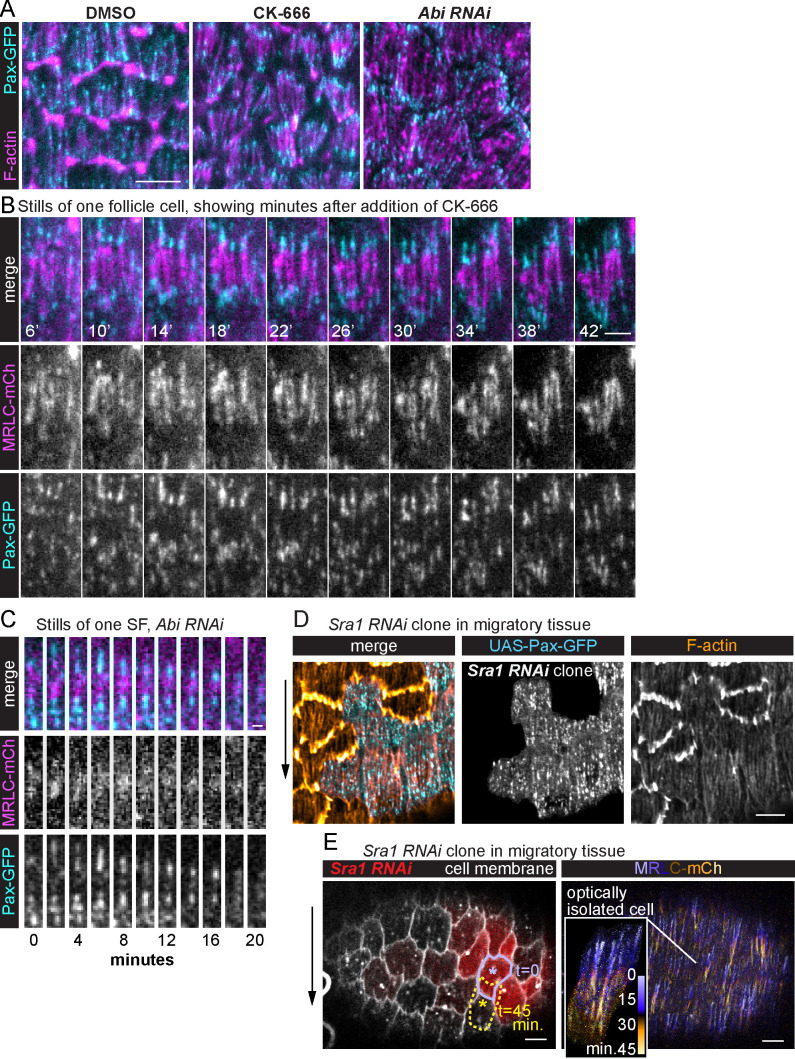
Figure 5. Stress fiber (SF) treadmilling depends on cell migration.
(A) Images of epithelia in which migration has been blocked by eliminating leading-edge protrusions. Adhesions become concentrated at the SF ends. The images shown are representative of n = 28 (Dimethyl Sulfoxide [DMSO]), n = 29 (CK-666), and n = 16 (Abi RNAi) egg chambers that were analyzed. (B) Still images from a video of one cell showing that internal adhesions disappear, and end adhesions grow as addition of CK-666 slowly brings migration to a stop. The image shown is representative of eight egg chambers that were analyzed. See also Figure 5—video 1. (C) Still images from a video showing one SF in an epithelium in which migration has been blocked. The SF shortens and disappears with no new adhesions added to the ends. The images shown are representative of most SFs in eight egg chambers that were analyzed. (D) Image of a migrating epithelium with a clone of cells expressing Sra1 RNAi to eliminate protrusions. The SFs in the clone maintain internal adhesions. The image shown is representative of six egg chambers that were analyzed. (E) Still image from a video of a migrating epithelium with a clone of cells that expresses Sra1 RNAi to eliminate protrusions (left). Outline shows the movement of one cell over 45 min (lavender to yellow asterisks). Temporal projection of the SFs in the same epithelium at 20-s intervals (right). Inset shows SF growth in the Sra1 RNAi cell marked with the asterisk on the left. The image shown is representative of three egg chambers that were analyzed. Experiments performed at stage 7. Black arrows show migration direction. Scale bars: 5 µm (A, D, E), 1 µm (B), 2 µm (C).

