. 2021 Nov 23;10:e72881. doi: 10.7554/eLife.72881

Figure 6. Dishevelled-associated activator of morphogenesis (DAAM) contributes to treadmilling stress fiber (SF) assembly.

(A–C) Images of epithelia with clones of cells expressing various transgenes. (A) Abi RNAi reduces F-actin in protrusions but not SFs. (B) DAAM RNAi reduces F-actin in SFs. (C) An activated form of DAAM (C-DAAM) increases F-actin in SFs. (D) Quantification of the data in (A–C). Each point is the ratio of the mean value for F-actin levels in SFs from 10 experimental cells and 10 nearby control cells in the same egg chamber. In order on graph, n = 7, 13, 17, 10, 10 egg chambers. Bars show medians and interquartile ranges. Two-tailed Wilcoxon matched pairs signed ranks test. NS (not significant) p > 0.05, **p < 0.01, ***p < 0.001, ****p < 0.0001. See Figure 6—figure supplement 1 for tests of additional actin assembly factors. (E) Image of a transverse section through an epithelium with a clone of DAAMA mutant cells, representative of 11 egg chambers. Loss of DAAM does not obviously reduce cortical F-actin on lateral or apical surfaces. Experiments performed at stage 7. Black arrows show migration direction. Scale bars: 5 µm.

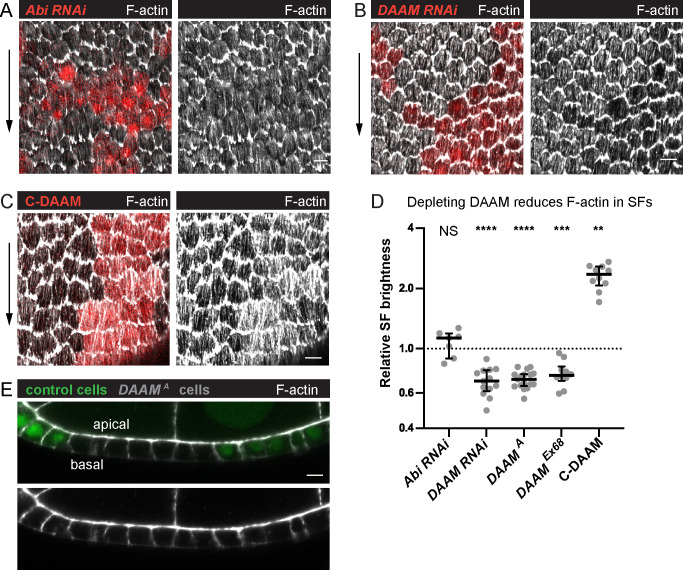
Figure 6—source data 1. Excel file containing the numeric data and exact p values used to generate the graphs in Figure 6 and Figure 6—figure supplement 1.
Each tab on the spreadsheet corresponds to one graph.

Figure 6.

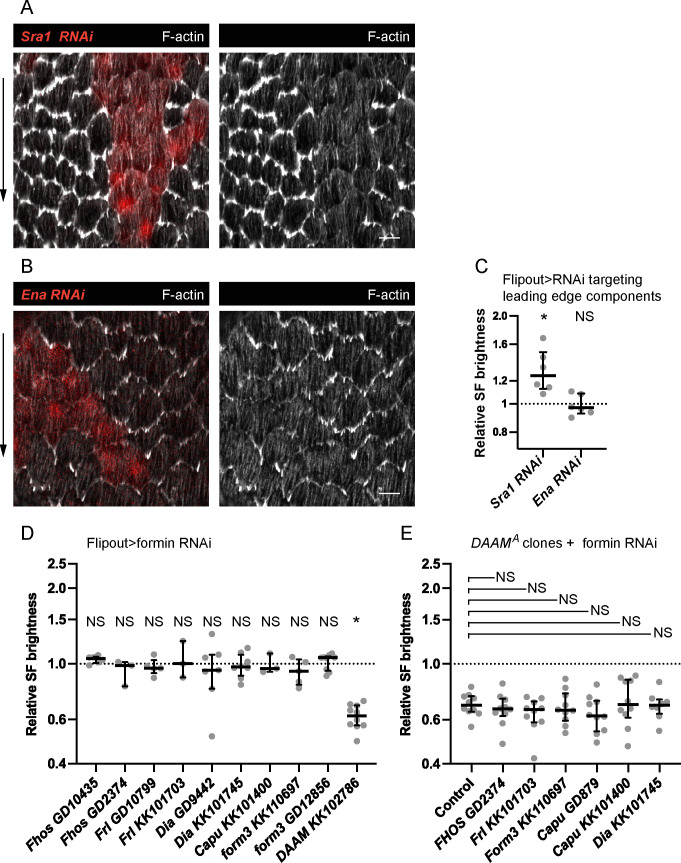
Figure 6—figure supplement 1. A screen for F-actin assembly factors that mediate treadmilling stress fiber (SF) formation.

Figure 6—figure supplement 1.

Images of epithelia with clones of cells expressing (A) Sra1 RNAi and (B) Ena RNAi. F-actin levels are reduced in leading-edge protrusions but not in SFs. (C) Quantification of the data in (A, B). F-actin levels in SFs are the same or higher than controls for both conditions. In order on graph, n = 6, 6 egg chambers. (D) Quantification of SF F-actin levels in clones of cells expressing RNAi against various formins. In order on graph, n = 6, 3, 5, 3, 7, 8, 3, 5, 9, 10 egg chambers. (E) Quantification of SF F-actin levels in DAAM mutant clones that are within epithelia that also express RNAi against various formins. In order on graph, n = 10, 10, 10, 10, 10, 10, 8 egg chambers. Experiments performed at stage 7. Black arrows show migration direction. Scale bars: 5 µm. (C–E) Each point is the ratio of the mean value for F-actin levels in SFs from 10 experimental cells and 10 control cells in the same egg chamber. Bars show medians and interquartile ranges. NS (not significant) p > 0.05, *p < 0.05. (C, D) Two-tailed Wilcoxon matched pairs signed ranks test. (E) Two-tailed Mann–Whitney compared to control.