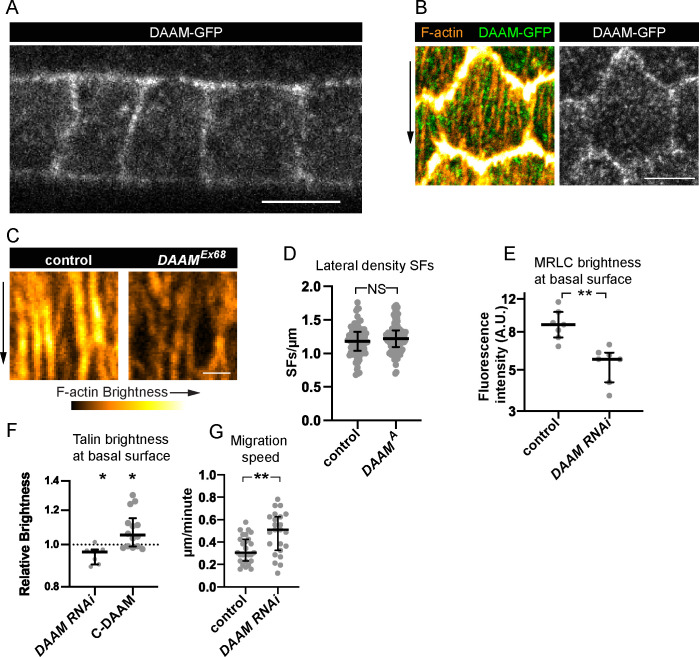
Figure 7. Dishevelled-associated activator of morphogenesis (DAAM) localizes to the cortex and likely strengthens cell–extracellular matrix (ECM) adhesion via stress fibers (SFs).
(A, B) Images of DAAM-GFP (endogenous tag). (A) Transverse section showing that DAAM localizes to the entire cell cortex, image representative of five egg chambers. (B) Basal view of one cell showing DAAM relative to SFs, image representative of five egg chambers. (C) Images of SFs from a control cell and DAAMEx68 cell in the same epithelium stained with phalloidin. SFs in DAAMEx68 cells are similar in number but have reduced F-actin fluorescence. Image representative of three egg chambers. (D) Quantification showing that lateral SF density is normal in DAAMA cells. In order on graph, n = 90, 90 cells from 9 egg chambers with mitotic clones. (E) Quantification showing that myosin regulatory light chain (MRLC) levels are reduced in DAAM RNAi cells. In order on graph, n = 7, 7 egg chambers. (F) Quantification showing that Talin levels are reduced in DAAM RNAi cells. Each point is the ratio of the mean value for Talin levels from 10 experimental cells and 10 control cells in the same egg chamber. In order on graph, n = 7, 14 egg chambers. (G) Quantification of migration rates for control and DAAM RNAi epithelia. In order on graph, n = 27, 23 egg chambers. Experiments performed at stage 7. Black arrows show migration direction. Scale bars: 5 µm (A, B), 1 µm (C). (E–H) Bars show medians and interquartile ranges. NS (not significant) p > 0.05, *p < 0.05, **p < 0.01. (D, E, G) Two-tailed Mann–Whitney test. (F) Two-tailed Wilcoxon matched pairs signed ranks test.

