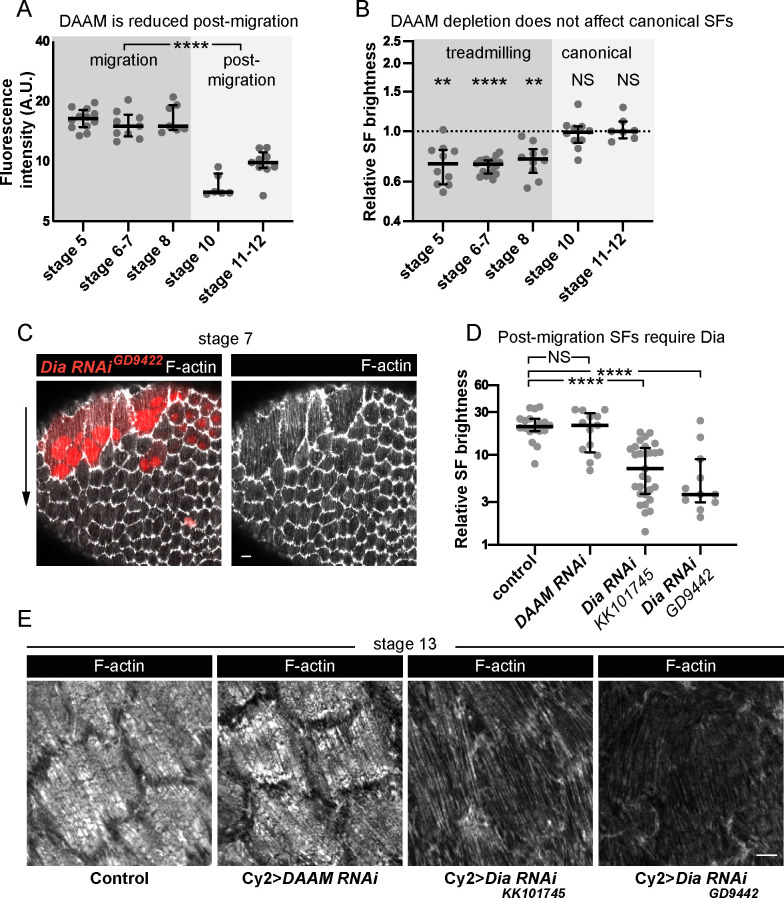
Figure 8. Different formins contribute to treadmilling versus canonical stress fibers (SFs).
(A) Quantification of Dishevelled-associated activator of morphogenesis (DAAM)-GFP levels at basal surface. Levels are higher during migration stages. In order on graph, n = 12, 9, 7, 6, 9 egg chambers. Statistics are on pooled data from migration versus postmigration stages. Two-tailed Mann–Whitney test. (B) Quantification of F-actin levels in SFs. Loss of DAAM reduces F-actin in treadmilling SFs, but not canonical SFs. Each point is the ratio of the mean value for 10 RNAi cells and 10 control cells in the same egg chamber. In order on graph, n = 10, 17, 10, 10, 7 egg chambers. Statistics by stage are two-tailed Wilcoxon matched pairs signed ranks tests. (C) Image of an epithelium with a clone of cells expressing Dia RNAi. Dia RNAi cells have cytokinesis defects shown by multiple red nuclei per cell, but F-actin levels in SFs are normal. (D) Quantification of F-actin levels in SFs at stage 13. When Cy2-Gal4 is used to drive RNAi during postmigration stages, Dia RNAi reduces F-actin in SFs, but DAAM RNAi does not. In order on graph, n = 18, 13, 29, 11 egg chambers. Two-tailed Mann–Whitney tests. (E) Images of cells showing that Dia RNAi reduces F-actin levels in SFs postmigration while DAAM RNAi does not (images selected from intermediate brightness values measured in D). Scale bars: 5 µm. (A, B, D) Bars show medians and interquartile ranges. NS (not significant) p > 0.05, **p < 0.01, ****p < 0.0001.

