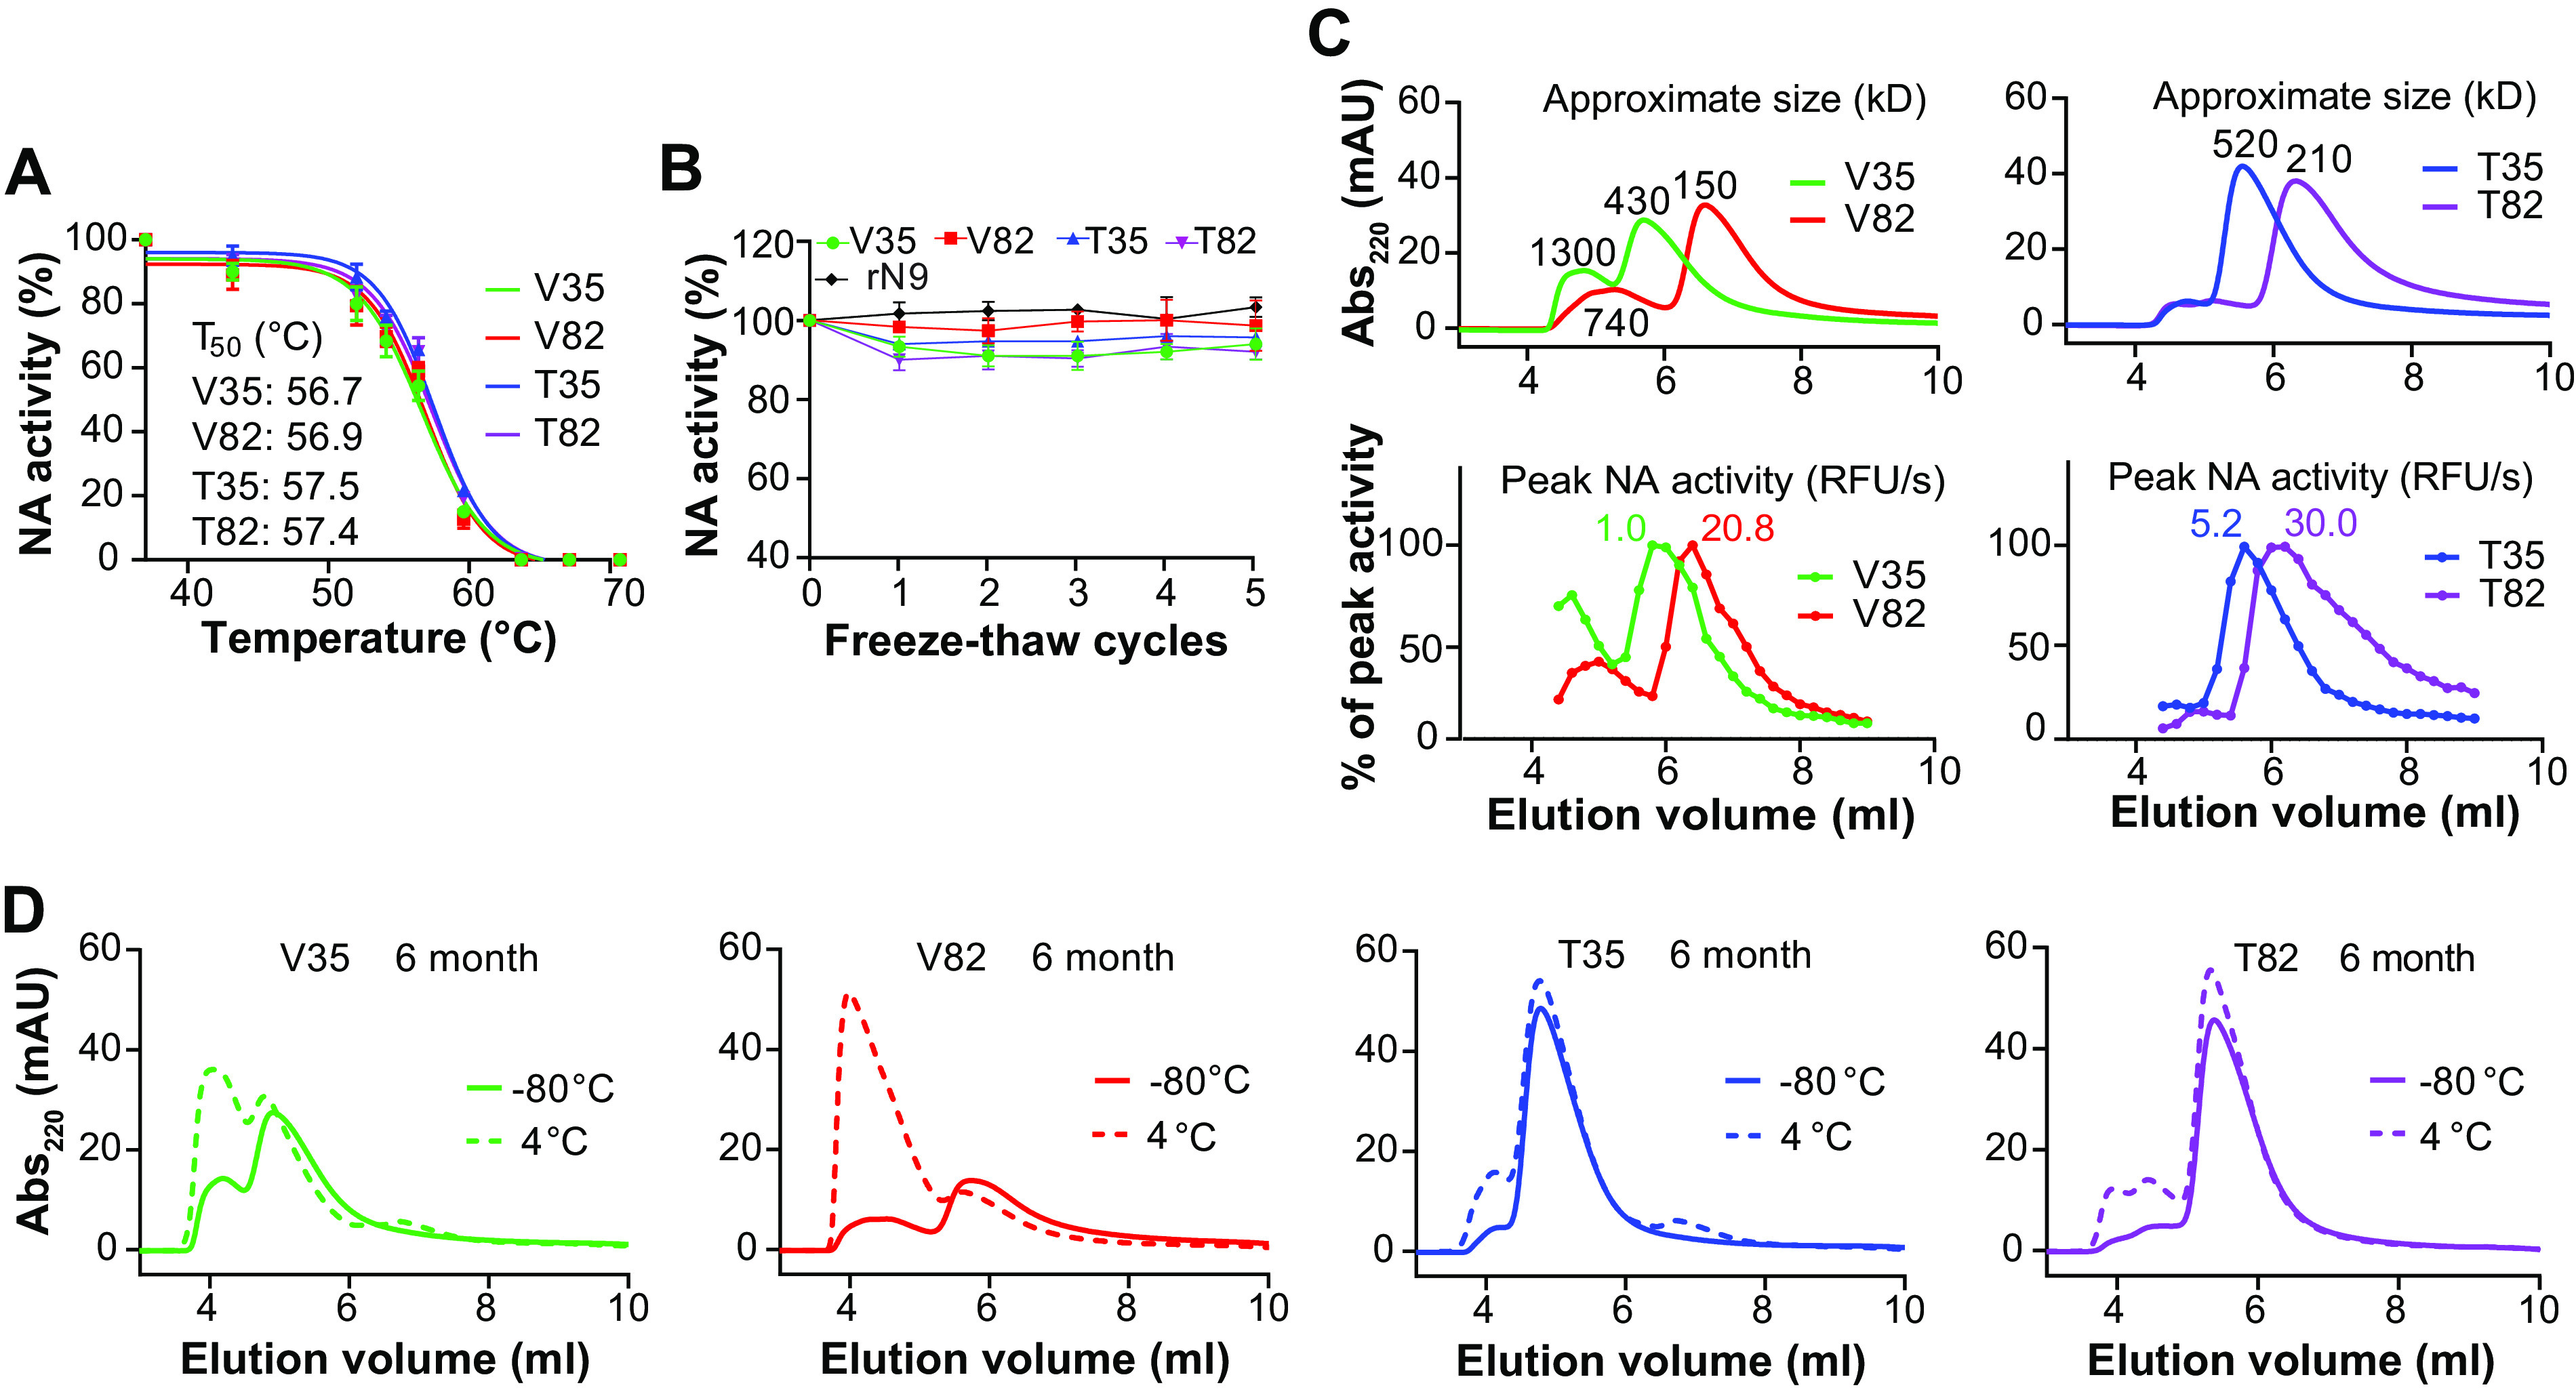
FIG 4.

Stability similarities and variations between N1-BR18 rNAs. (A) Graphs displaying the thermal melt curves for the rNAs. The rNAs were incubated for 10 min at the indicated temperatures, and the enzymatic activity was measured and normalized using the activity of the sample at 37°C. Shown are the means ± SD of the data from three technical repeats together with the T50 values for each rNA. (B) The rNAs were subjected to 5 cycles of freezing on dry ice for 10 min and thawing briefly at 37°C. The enzymatic activity was measured following each freeze-thaw cycle and normalized using the activity from an untreated sample. Means ± SD from three technical repeats are displayed. rN9, rNA from A/Anhui/1/2013 (H7N9) expressed in human embryonic kidney 293 cells. (C) SEC profiles of the rNAs shortly after purification. The rNAs were adjusted to 0.5 mg/ml, and equal volumes were loaded onto an SEC column. The absorbance at 220 nm (Abs220) versus the elution volume is shown with the estimated molecular weights corresponding to each peak (top panels). The NA activity profiles of fractions collected between 4.0 and 8.8 ml are shown in the bottom panels, with the activity of each fraction being normalized to the peak activity, which is displayed for each rNA. mAU, milli-absorbance units. (D) SEC profiles of the rNAs stored at −80°C or 4°C for 6 months.
