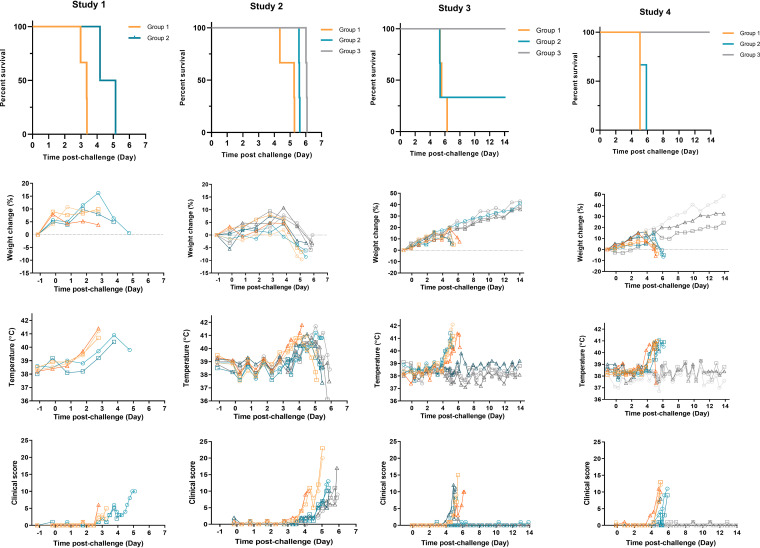
FIG 2.
Survival and clinical observations. (a) Survival of ferrets was plotted as a Kaplan-Meier survival curve calculated by postchallenge time to euthanasia decision. (b) Weight was recorded daily, and percent weight change from baseline was plotted. Points show values for individual animals. (c) Temperatures were taken at the same time as clinical observations, using the identifier chip, to ensure any peak of fever was recorded. Individual animal temperatures are displayed on the graph. (d) Clinical observations were carried out twice daily four to six times daily during the period of onset of clinical symptoms. Observations were summed for each ferret based the following scores: healthy, 0; arched back, 1; dehydrated/not drinking, 1; rash, 1; gait changes, 1; wasp waisted, 1; ruffled fur, 1; nasal discharge, 1; sneezing, 1; shivering, 1; lethargic, 2; vomiting, 2; depression, 2; diarrhea, 2; labored breathing, 3; temperature, >39°C, 1; temperature, >40°C, 2; weight loss, >5% from maximum, 1; weight loss, >10% from maximum, 2. n = 3 ferrets per group. Study 1, group 1, 5.6 × 10⁴ TCID50, orange lines; group 2, 5.6 × 101 TCID50 teal lines; study 2, group 1, 5.6 × 101 TCID50, orange lines; group 2, 5.6 × 100 TCID50 teal lines; group 3, 5.6 × 10⁻¹ TCID50 gray lines. Study 3, group 1, 5.6 × 10⁻¹ TCID50, orange lines; group 2, 5.6 × 10⁻² TCID50 teal lines; group 3, 5.6 × 10⁻³ TCID50 gray lines. Study 4 group 1, 5.6 × 10⁻¹ TCID50, orange lines; group 2, 5.6 × 10⁻² TCID50 teal lines; group 3, 5.6 × 10⁻³ TCID50 gray lines.

