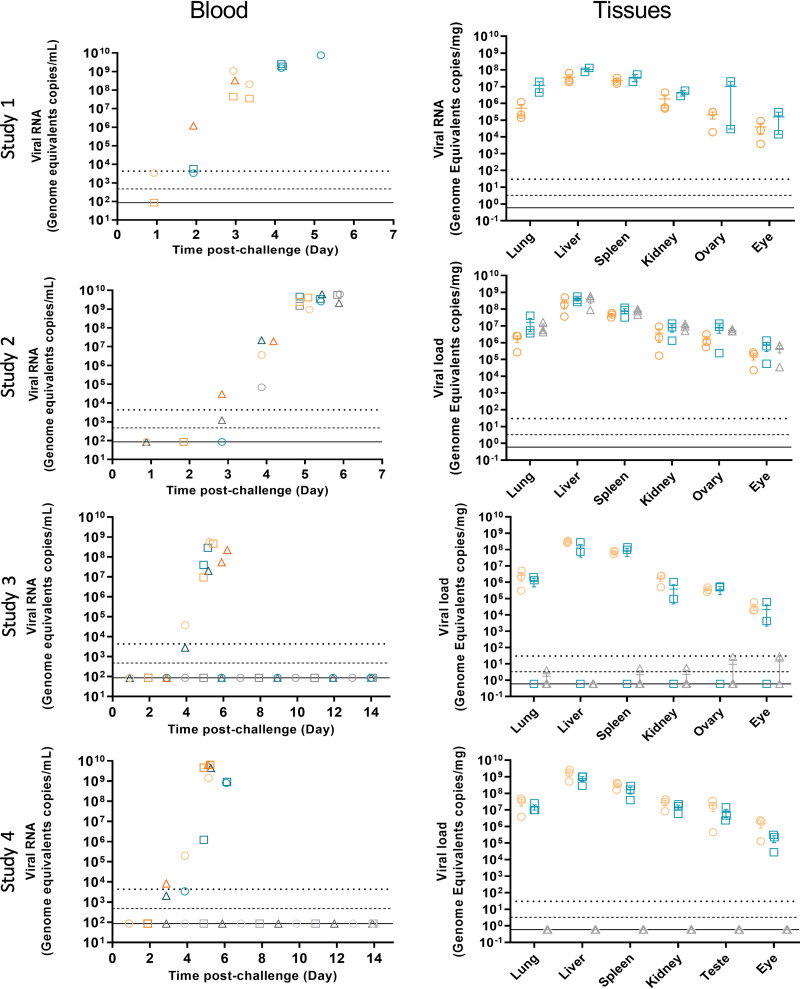
FIG 3.
Viral load. Viral RNA was measured in the blood and tissues by RT-qPCR. Blood viral RNA was measured from one animal from each group at each time point. Tissue viral RNA was measured from each animal at euthanasia. The results are plotted as mean ± standard. Group 1, 5.6 × 10⁻¹ TCID50, orange symbols; group 2, 5.6 × 10⁻² TCID50, teal symbols; group 3, 5.6 × 10⁻³ TCID50, gray symbols. Upper dotted line is the lower limit of quantification (LLOQ). Dashed line is the limit of detection (LOD), and solid line is the theoretical minimum detectable amount (TDMA).

