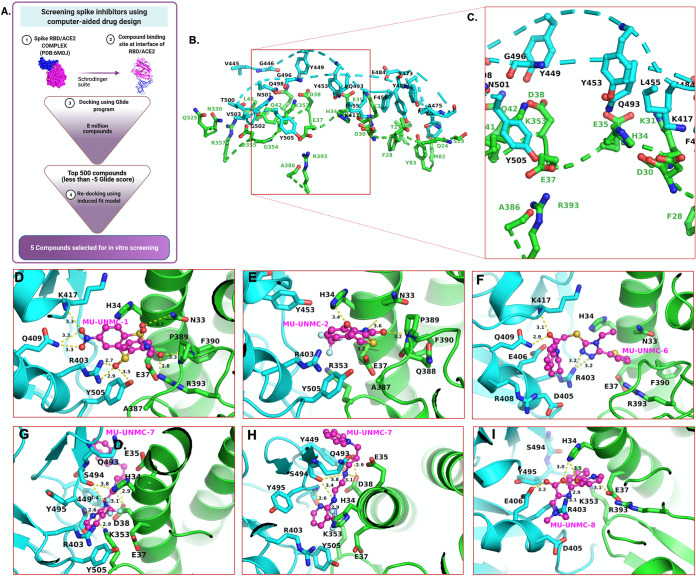
FIG 1.
In-silico screening of SARS-CoV-2 entry inhibitors. (A) Flow chart of screening Spike inhibitors using computer-aided drug designing approach. Panels B and C show the residues at the interface of S-RBD and ACE2 and zoomed-in view of the pocket selected for compound docking, respectively. An R programing package Bio3D determined the interface residues, and the figures were generated using PyMol software. The dotted line shows the discontinuous backbone of the protein (S-RBD, cyan, and ACE2, green). (D–I) Molecular docking of five compounds selected based on their glide score for in vitro screening of their antiviral activity against SARS-CoV-2. Panels G and H show the two orientations of MU-UNMC-7. The yellow dotted lines represent the polar interactions formed by the compounds with the nearest protein residues. The ACE2 residues represented as sticks are green carbons, whereas S-RBD residues are colored as cyan sticks. The protein backbone is represented as ribbons (green = ACE2 and cyan = S-RBD). The MU-UNMC compounds are shown in ball-and-stick representations with magenta carbons. All other atoms are colored by atom type (red = oxygen, blue = nitrogen, orange = sulfur, turquoise = fluorine, and light green = chlorine).

