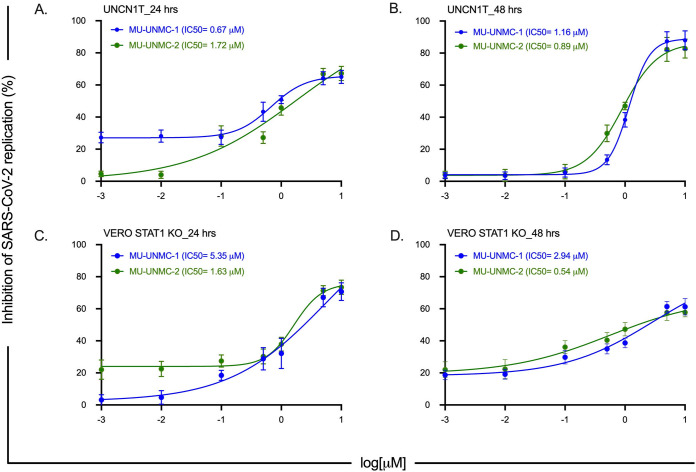
FIG 6.
SARS-CoV-2 dose-response curve in MU-UNMC-1 and MU-UNMC-2 treated and SARS-CoV-2 infected UNCN1T and Vero-STAT1 knockout cells. (A, B) MU-UNMC-1 (in blue) and MU-UNMC-2 (in green) dose-response curve by percentage inhibition of SARS-CoV-2 replication 24 and 48 hpi in UNCN1T cells with indicated drug concentrations. (C, D) MU-UNMC-1 (in blue) and MU-UNMC-2 (in green) dose-response curve by percentage inhibition of SARS-CoV-2 replication 24 and 48 hpi in Vero-STAT1 knockout cells with indicated compound concentrations.

