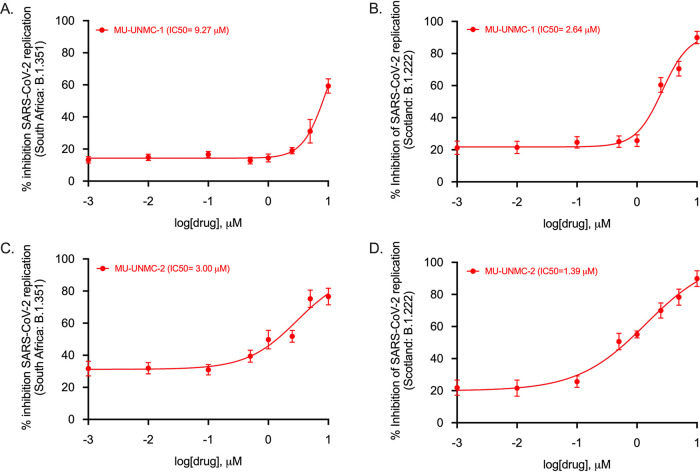
FIG 7.
SARS-CoV-2 dose-response curve in MU-UNMC-1 and MU-UNMC-2 treated and SARS-CoV-2 variant of concern infected Calu-3 cells. (A) MU-UNMC-1 dose-response curve by percentage inhibition of SARS-CoV-2 replication 24 hpi in Calu-3 cells infected with South Africa variant (linage: B.1.351) with indicated drug concentrations. (B) MU-UNMC-1 dose-response curve by percentage inhibition of SARS-CoV-2 replication 24 hpi in Calu-3 cells infected with Scotland variant (linage: B.1.222) with indicated drug concentrations. (C) MU-UNMC-2 dose-response curve by percentage inhibition of SARS-CoV-2 replication 24 hpi in Calu-3 cells infected with South Africa variant (linage: B.1.351) with indicated drug concentrations. (D) MU-UNMC-2 dose-response curve by percentage inhibition of SARS-CoV-2 replication 24 hpi in Calu-3 cells infected with Scotland variant (linage: B.1.222) with indicated drug concentrations.

