FIG 2.
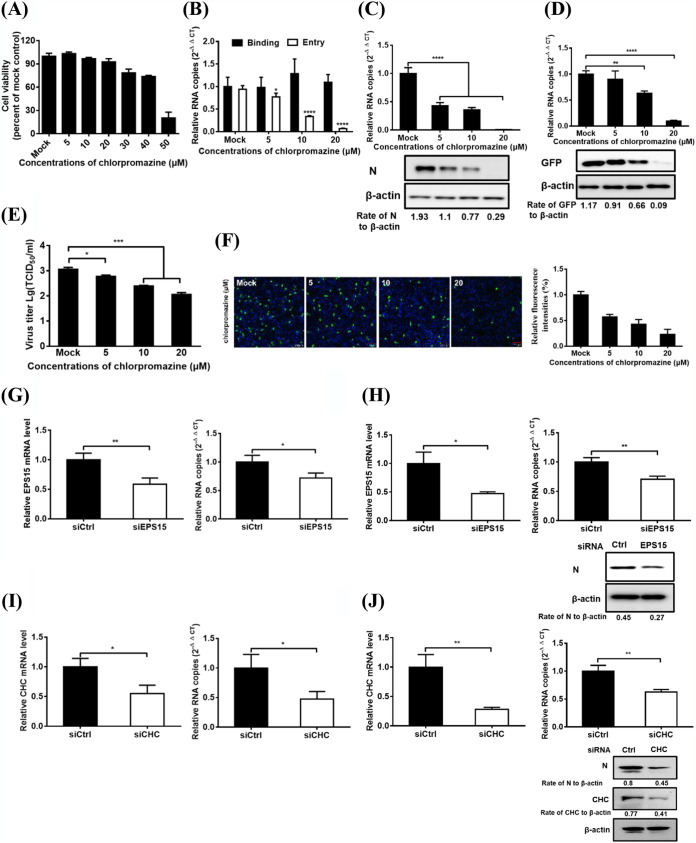
PDCoV entry into IPI-2I cells requires clathrin. (A) CCK-8-based cell viability assay for chlorpromazine as described in Materials and Methods. (B) Chlorpromazine inhibited PDCoV entry but not binding. IPI-2I cells were pretreated with subtoxic doses at 37°C for 1 h and infected with PDCoV (MOI of 5) at 4°C for 1 h (binding step) and then shifted to 37°C for 1 h (entry step). Cells were lysed to determine viral RNA copy numbers by RT-qPCR. (C and D) RT-qPCR and Western blot analysis for inhibition of PDCoV (C) and VSV-GFP (D) infections by chlorpromazine. Cells were pretreated with increasing subtoxic doses of chlorpromazine or DMSO at 37°C for 1 h and then inoculated with VSV-GFP or PDCoV (MOI of 5) at 37°C for 6 h. Cells were lysed to determine viral RNA copy numbers via RT-qPCR and viral protein levels via Western blotting. (E) Viral titer detection for PDCoV in the medium from cells treated as described in panel C. (F) IFA for viral infection inhibition by chlorpromazine. Cells were pretreated as described in panel C, followed by IFA using anti-PDCoV N antibody. Relative fluorescence intensity is quantified by Image‐Pro Plus software as shown in panel F on the right. (G and H) EPS15 knockdown inhibited PDCoV entry (G) and infection (H). siEPS15- or siCtrl-transfected cells were infected with PDCoV (MOI of 5). At 1 and 6 hpi at 37°C, cells were lysed to determine the silencing efficiency of EPS15, the viral RNA copy numbers via RT-qPCR, and N protein expression levels by Western blotting. (I and J) CHC knockdown inhibited PDCoV entry (I) and infection (J). siCHC- or siCtrl-transfected cells were infected with PDCoV (MOI of 5). At 1 and 6 hpi at 37°C, the cells were lysed to determine the viral RNA copy numbers and N protein expression levels via RT-qPCR and Western blot analysis, respectively. Target protein expression was quantitatively estimated by ImageJ software and presented as the density value relative to that of the β-actin. The presented results represent the means and standard deviations of data from three independent experiments. *, P < 0.05; **, P < 0.01; ***, P < 0.001; ****, P < 0.0001.

