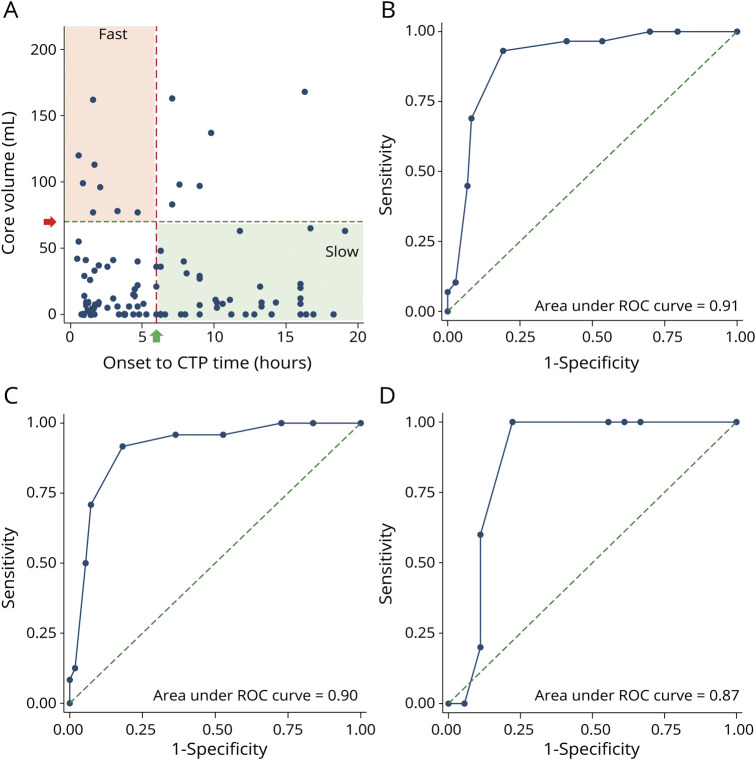
Figure 2. Patient Distribution by Core Volume to Time Since Stroke Onset and Receiver Operating Characteristics.
(A) Distribution of cohort by time since onset vs core volume. Onset to CT perfusion (CTP) time in hours (x-axis) plotted against core volume in mL (y-axis). Patients with stroke towards bottom left and top right remain unclassified by reperfusion trial core time criteria (see Methods). Bottom left area represents group of patients physicians may be especially interested in to differentiate fast from slow rate of core progression. (B) Receiver operating characteristic (ROC) curve for optimal hypoperfusion index (HI) cutoff (0.5) to distinguish fast and slow rate of core progression in entire cohort. (C) ROC curve for optimal HI cutoff (0.5) to distinguish fast and slow rate of core progression in large vessel occlusion stroke. (D) ROC curve for optimal HI cutoff (0.5) to distinguish fast and slow rate of core progression in medium vessel occlusion stroke.

